Search results for: “Norway Norwegian”
-
Offshore oilfields: development capex over time in Norway?
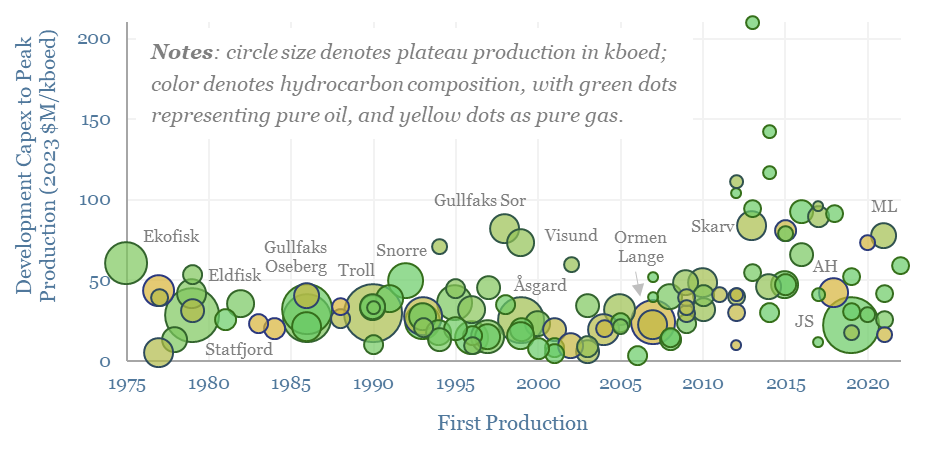
Across 130 offshore oil fields in Norway, going back ato 1975, real development capex per flowing barrel of production has averaged $33M/kboed. Average costs have been 2x higher when building during a boom, when one-third of projects blew out to around $100M/kboed or higher. The data support countercyclical investment strategies in energy.
-
EV incentives: vehicle taxes by country?
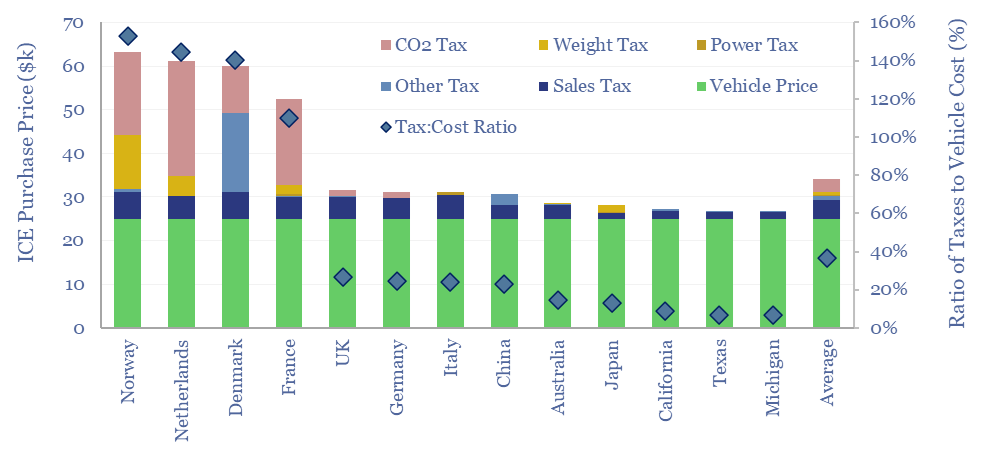
Vehicle taxes by country are tabulated in this data-file, based on vehicles’ pre-tax prices, tailpipe emissions, weight, engine size and power. They range from sub-10% of the cost of the underlying vehicle in the US, through to 150% in Norway, and above 100% in Netherlands, Denmark and France. What implications for EV adoption?
-
LNG liquefaction technologies: an overview?
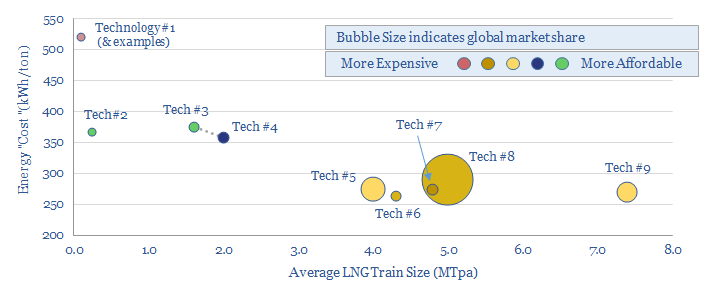
This data-file is an overview of different LNG liquefaction technologies: APCI, APX, Optimised Cascade, Fluid Cascade, DMR, SMR, PRICO and MMLS. A typical LNG liquefaction plant has energy intensity of 280kWh/ton, consuming 5% of the input gas entering the plant, with 20kg/boe of Scope 1&2 CO2 intensity. But efficient and electric-drive compression can lower these…
-
Development Concepts: how much CO2?
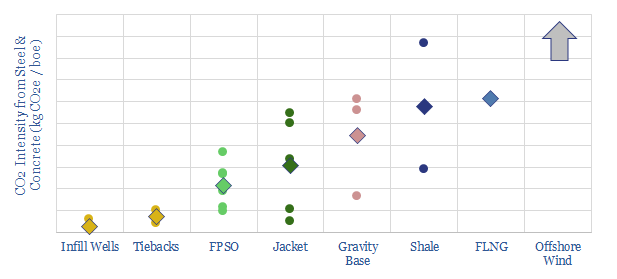
We tabulate c25 oil projects, breaking down the total tons of steel and concrete used in their topsides, jackets, hulls, wells, SURF and pipelines. Infill wells, tiebacks and FPSOs make the most CO2-efficient use of construction materials per barrel of production, helping to minimise emissions. Fixed leg platforms are higher CO2, then gravity based structures, then…
-
Northern Lights CCS: the economics?
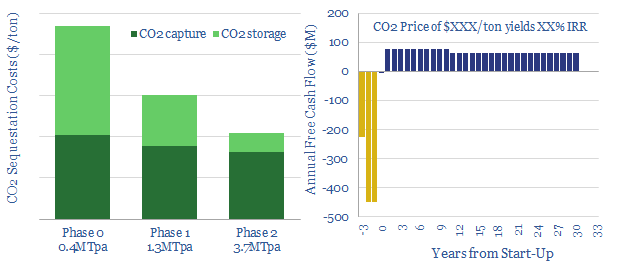
We have modeled out simple economics for Northern Lights, the most elaborate CCS scheme proposed by the energy industry (Equinor, Shell, TOTAL). The project involves capturing 1.3-1.5MTpa of industrial CO2, shipping it, piping it 110km offshore, then injecting it 3,000m below Norway’s seabed. Costs are expensive. But phase 2 could benefit from scale, offering “CO2…
-
CO2 Intensity of Oilfield Supply Chains
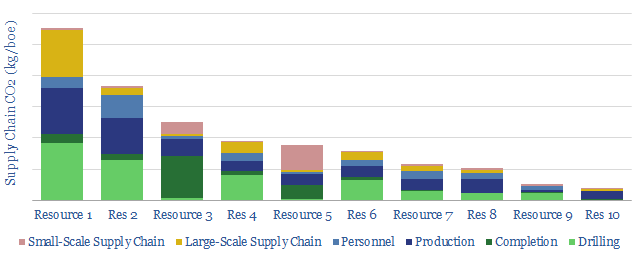
What is more CO2-intensive: the c4,000 truck trips needed to complete a shale well, or giant offshore service vessels (OSVs), which each consume >100bpd of fuel? This data-file quantifies the CO2 intensity of supply-chains, for 10 different resource types, as a function of 30 input variables.
-
Power from Shore: the economics?
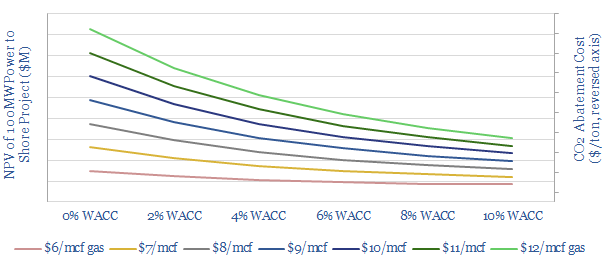
We model the economics of powering an oil platform from shore, using cheap renewable power instead of traditional gas turbines. This can lower upstream CO2 emissions by by around 70%, saving 5-15kg/bbl, for a cost of $50-100/ton. NPVs can be positive with low WACCs and high gas prices, but the primary aim is low-cost decarbonisation.
-
Energy self-sufficiency by country and over time?
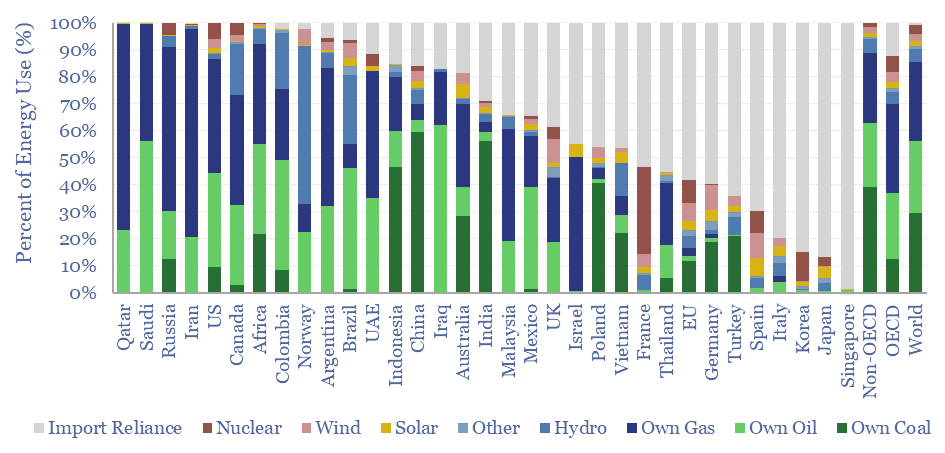
This data-file tabulates energy self-sufficiency, by country, over time, across 30 of the largest economies in the world. Among this sample, the median country generates 70% of its energy domestically, and is reliant on imports for 30% of the remainder. Energy self-sufficiency varies vastly by country.
-
Global oil production by country?
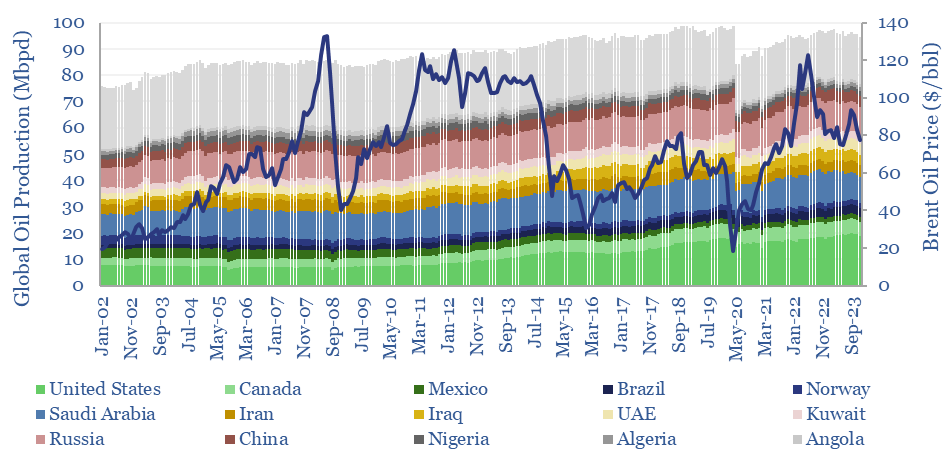
Global oil production by country by month is aggregated across 35 countries that produce 80kbpd of crude, NGLs and condensate, explaining >96% of the global oil market. Production has grown by +1Mbpd/year in the past two-decades, led by the US, Iraq, Russia, Canada. Oil market volatility is usually low, at +/- 1.5% per year, of…
-
Inflow Control: Our Top 20 Papers from 2019
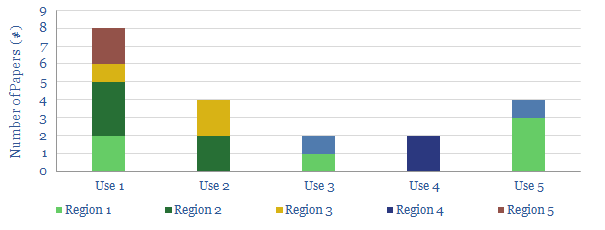
This data-file summarises twenty recent papers using inflow control devices: an exciting digital technology to optimise horizontal wells by limiting production from zones that are susceptible to flowing water or gas. Each paper is categorized by company, country, field and focus. Also included are our ‘Top 10’ facts from the technical literature.
Content by Category
- Batteries (89)
- Biofuels (44)
- Carbon Intensity (49)
- CCS (63)
- CO2 Removals (9)
- Coal (38)
- Company Diligence (94)
- Data Models (838)
- Decarbonization (160)
- Demand (110)
- Digital (59)
- Downstream (44)
- Economic Model (204)
- Energy Efficiency (75)
- Hydrogen (63)
- Industry Data (279)
- LNG (48)
- Materials (82)
- Metals (80)
- Midstream (43)
- Natural Gas (148)
- Nature (76)
- Nuclear (23)
- Oil (164)
- Patents (38)
- Plastics (44)
- Power Grids (130)
- Renewables (149)
- Screen (117)
- Semiconductors (32)
- Shale (51)
- Solar (68)
- Supply-Demand (45)
- Vehicles (90)
- Wind (44)
- Written Research (354)