Industry Data
-
How do LNG costs vary with plant size?
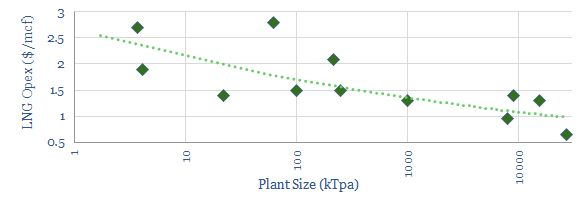
This data-file tabulates a dozen data-points on LNG plant opex, from company disclosures, the technical literature and academic papers. Opex is a function of plant size, and tends to fall by $0.3/mcf for each 10x change in plant capacity.
-
Wind: aim higher?
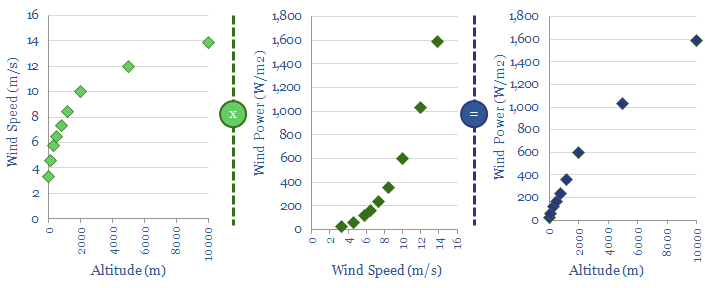
This data-file contains a simple model for how wind speeds and wind power co-vary with altitude. 2x greater power could likely be harnessed by a kite at 300m than a similar-sized turbine at 80m.
-
Costs of an LNG fuelling station
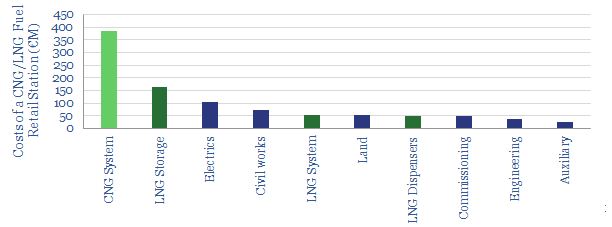
We have tabulated the costs of constructing an LNG-fuelling station across 55 cost lines, totalling €1M/site. c$10/mcf may be added to the cost of gas as a fuel.
-
Maintenance costs for gas-powered trucks?
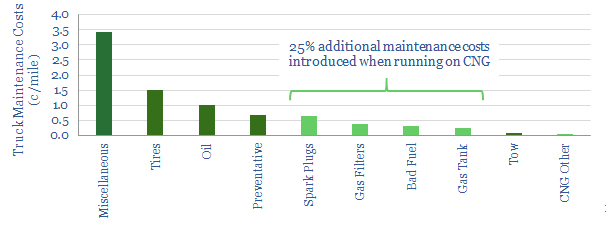
Maintenance costs are tabulated by category, for a fleet of compressed natural gas (CNG) trucks, travelling 16M miles across the United States.
-
Landfill costs: by country and over time?
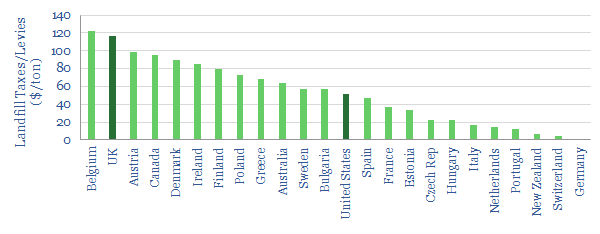
This data-file tabulates the most likely costs of placing waste-material (e.g., plastic) into landfill, country by country, and over time. Landfill taxes have risen at an 8% CAGR on average, clearly reduce landfilling rates, and promote recycling. This short note spells out our top five conclusions on landfill taxes by country and over time.
-
Global shipping and the switch from fuel oil?
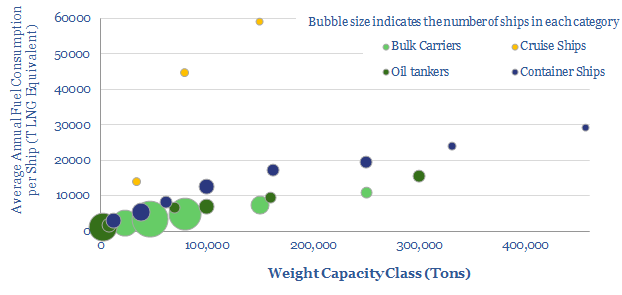
The 240MTpa shipping-fuels market will be disrupted from 2020, under IMO sulphur regulations. Hence, this data-file breaks down the world’s 100,000-vessel shipping fleet into 13 distinct categories. We see 40-60MTpa upside to LNG demand from 2040.
-
Production Losses at a Giant Offshore Oilfield
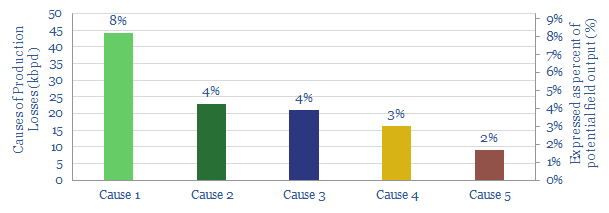
This data-file breaks down the production losses at a giant offshore oilfield, across five categories and ten sub-categories. They are addressable with digital oilfield technologies, as shown by our notes. Advanced algorithms such as BP’s Apex solution, are capable of reducing the losses — particularly in the largest categories. Halving them could increase output by…
-
Oil Major Cash Flow and Operating Leverage
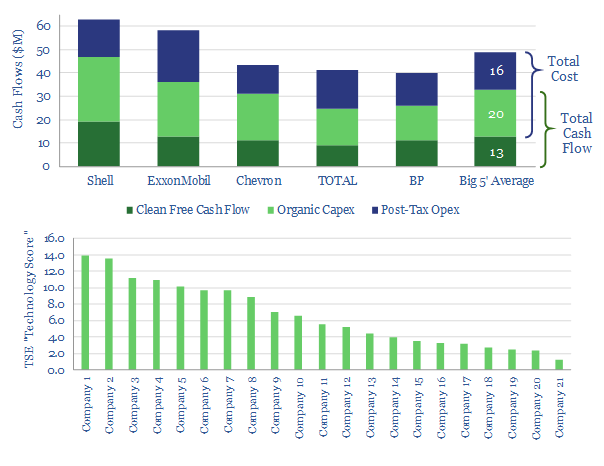
This data-file tabulates the approximate cash flow, capex and ‘pre-tax costs’ of Oil Majors, to illustrate the group’s operational leverage. Every $1 of free cash flow comes after $3 of cost.
Content by Category
- Batteries (95)
- Biofuels (44)
- Carbon Intensity (48)
- CCS (64)
- CO2 Removals (9)
- Coal (41)
- Commentary (65)
- Company Diligence (104)
- Data Models (920)
- Decarbonization (162)
- Demand (129)
- Digital (86)
- Downstream (47)
- Economic Model (220)
- Energy Efficiency (76)
- Hydrogen (63)
- Industry Data (308)
- LNG (56)
- Materials (86)
- Metals (88)
- Midstream (45)
- Natural Gas (161)
- Nature (76)
- Nuclear (28)
- Oil (175)
- Patents (39)
- Plastics (44)
- Power Grids (155)
- Renewables (153)
- Screen (136)
- Semiconductors (35)
- Shale (58)
- Solar (72)
- Supply-Demand (53)
- Vehicles (95)
- Video (24)
- Wind (47)
- Written Research (405)