Global plastic demand: breakdown by product, region and use?
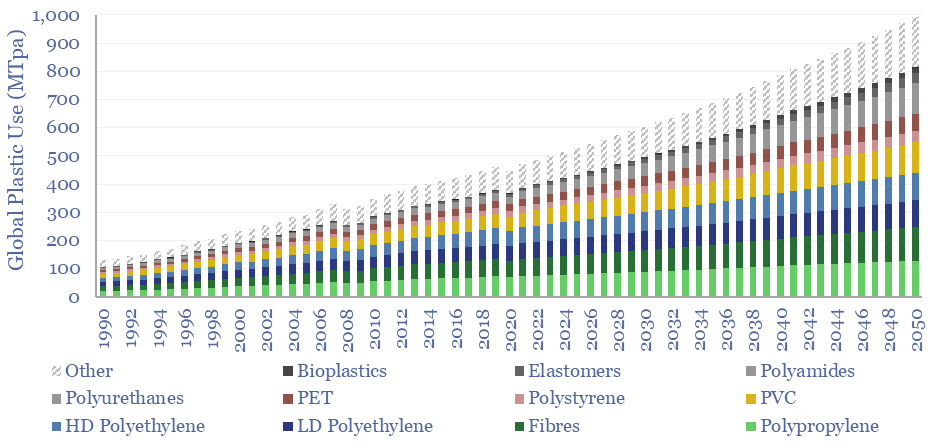
Global plastic is estimated at 470MTpa in 2022, rising to 1,000MTpa by 2050. This data-file is a breakdown of global plastic demand, by product, by region and by end use, with historical data back to 1990 and our forecasts out to 2050. Our top conclusions for plastic in the energy transition are summarized below.


Global plastic demand is estimated at 470MTpa in 2022. For perspective, the 100Mbpd global oil market equates to around 5bn tons per year of crude oil, showing that plastics comprise almost 10% of total global oil demand.

Our outlook in the energy transition sees increasing demand for polymers, most likely to 1,000MTpa by 2050. Many polymers are crucial inputs for new energies. Others are used for high-grade insulation, both thermal and electrical. Others for light-weight composites, which lower the energy consumption of transportation technologies.

Global plastic demand by region. The top billion people in the developed world comprise 12% of the world’s population, but 40% of the world’s plastic demand. We see developed world plastics demand running sideways through 2050, while emerging world demand doubles from 300MTpa to 700MTpa (charts below).

Global plastic demand CAGR? Our numbers are not aggressive and include a continued deceleration in the total global demand CAGR, from 7.5% pa growth in the twenty years ending in 1980, to 6% pa in the twenty years ended 2000, to 3.3% pa in the twenty years ended 2022 and around 2.5% pa in the period ending 2050.

Global plastic consumption per capita. Our numbers include an enormous policy push against waste in the developed world, where consumption today is around 170 kg of plastics per person per year. Conversely, plastic demand in the emerging world is 75% lower and averages 40 kg pp pa today, seen rising to 90 kg pp pa by 2050.

Upside to plastics demand? What worries us about these numbers is that they require historical trends to slow down. Historically, each $k pp pa of GDP is associated with 4kg pp pa of plastic demand. But our numbers assume slowing demand in the developed world and slowing demand in the emerging world (chart below).

Please download the model to stress-test your own variations. Underlying inputs are drawn from technical papers, OECD databases and Plastics Europe. The forecasts are our own.

Plastic demand by end use is broken down in the chart below. 35% of today’s plastics are used as packaging materials, 17% as construction materials and c10% for textiles.

The strongest growth outlook is in electrical products (currently 7-9%) and light-weighting transportation. There are few alternatives to plastics in these applications. Conversely, for packaging materials, we see more muted growth, and more substitution towards bioplastics and cellulose-based products from companies such as Stora Enso.

Upside for plastics in the energy transition is especially important, with plastics used in important components of the energy transition, from EVA encapsulants in solar panels, to the resins in wind turbine blades, to strong and light-weight components in more efficient vehicles, to polyurethane insulating materials surrounding substantively all electric components, batteries and vehicles. Of particular note are fluorinated polymers, where the C-F bond is highly inert, and helps resist degradation in electric vehicle batteries.

Plastic demand by material is broken down in the chart below. Today’s market is c20% polypropylene, c15% LDPE, and other large categories with >5% shares include HDPE, PVC, PET, Polyurethanes and Polystyrenes. We think the strongest growth will be in more recyclable plastics, materials linked to the energy transition, and next-gen materials that underpin new technologies such as additive manufacturing.

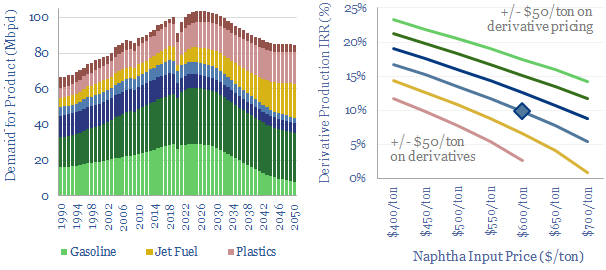
Feedstock deflation is likely to be a defining theme in the energy transition, as many polymers draw inputs from the catalytic reforming of naphtha. Today, 70% of BTX reformate is blended into gasoline, but we see this being displaced by the rise of electric vehicles, with particular upside for the polyurethane value chain.

Decarbonizing plastic production is also a topic in our research. As a starting point, our ethane cracker model is linked here, and our economic model for converting olefins into polymers is here. CO2 intensity of different plastics from different facilities is tabulated here.

Plastic recycling. We also see potential for plastic-recycling technologies to displace 8-15Mbpd of potential oil demand growth (i.e., naphtha, LPGs and ethane) by 2060, compared to a business-as-usual scenario of demand growth. All of our plastic recycling research is linked here. After a challenging pathway to de-risking this technology, we see front-runners emerging, such as Agilyx, Alterra and Plastic Energy.

Eastman: molecular recycling technology?

This patent screen reviews Eastman’s molecular recycling technology. Specifically, Eastman is spending over $2bn, to construct 3 plants, with 380kTpa of capacity, to break down hard-to-recycle polyesters back into component monomers, with 20-80% lower CO2 intensity than virgin product. We find evidence for 30-years of fine-tuning, and can bridge to 10% IRRs if buyers pay sufficient premia for the recycled outputs.


Eastman Chemical is a specialty materials company, founded in 1920, once part of Kodak, headquartered in Tennessee, with 14,000 employees, 2023 revenues of $9.2bn, EBIT of $1.3bn, and market cap of $11.5bn at the time of writing. It has 36 manufacturing facilities in 12 countries.

The reason for this patent screen is to explore whether Eastman has an edge in hard-to-recycle polyesters, via the methanolysis technology it has been fine-tuning for the past 30+ years, and where it is spending over $2bn to construct three 110-160kTpa facilities in the US and Normandy.

Specifically, Eastman notes “we are transforming the plastics industry by creating solutions that enable a circular economy for plastics, where waste is minimized and materials are reused and recycledโ€ฆ by leveraging our unique molecular recycling technologies, which allow us to convert plastic waste into high-performance, high-quality products”.

This data-file contains our notes on Eastman’s three polyester methanolysis plants, at Kingsport (Tennessee), Longview (Texas) and Normandy (France), tabulating disclosures into their capacities, costs and energy/CO2 intensities, which are 20-80% lower than virgin polyester production, which starts via naphtha cracking.

We have also assessed the economics of Eastman’s methanolysis technology, which dissolves polyesters in ethylene glycol and dimethyl terephthalate, then uses 200ยบC methanol at 30-50 psi of pressure to cleave apart the ester bonds, releasing more ethylene glycol and dimethyl terephthalate, which can later be separated out. We have based our EBIT calculations on ten years of polymer pricing history and on our broader model of mechanical plastic recycling.

Prices of materials relevant to plastics recycling: waste PET, ethylene glycol, dimethyl terephthalate, and methanol.

What economics for polyester methanolysis? IRRs, margins and total EBITDA for Eastman’s molecular recycling technology, at different pricing premia, are discussed in the data-file. 10% IRRs are achievable at these projects if buyers are willing to pay a premium for recycled products.

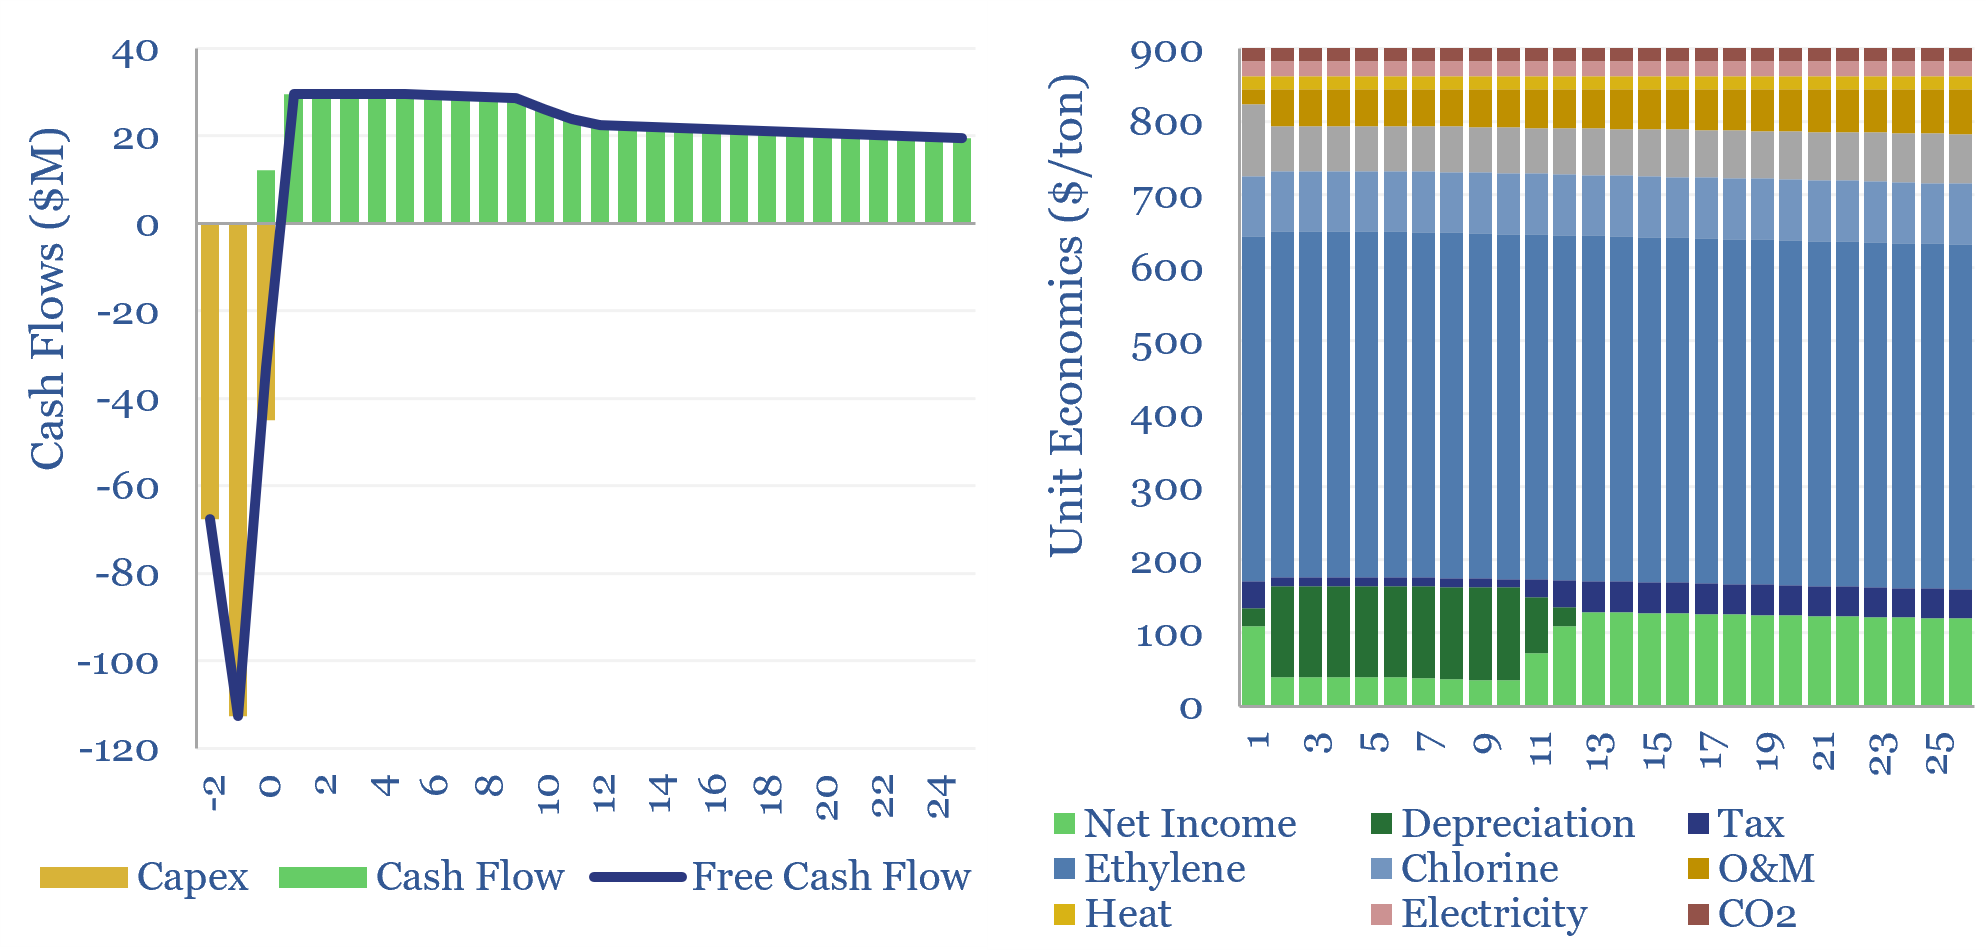
Cost of polyester methanolysis throughout the years and the cost buildup from different expense categories.

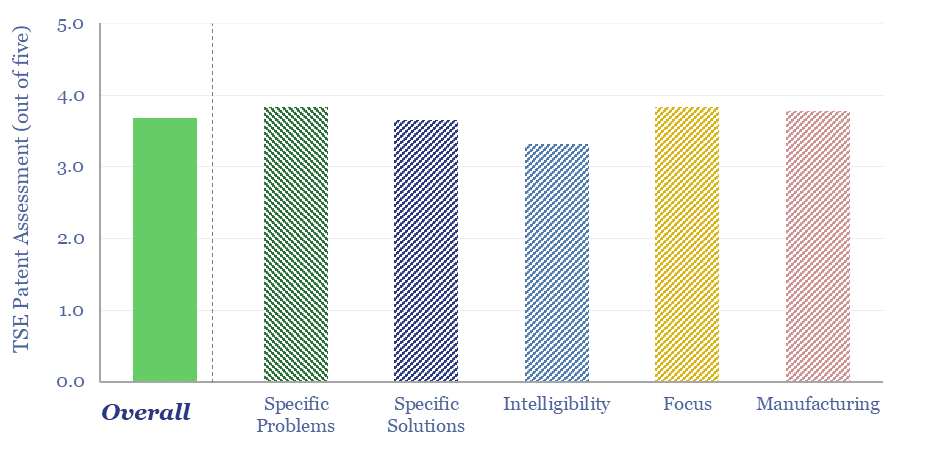
Finally, our sense from reviewing Eastman’s polyester methanolysis patents is that 30-years have been spent fine-tuning the yields, efficiency and resiliency. The key positive for us, was the patent disclosure into improved catalysts, which seems well locked-up.

The key challenge is the complexity of Eastman’s molecular recycling technology, which still seems sensitive to feedstock contaminants. Purifying side-reaction products is also adding to the high capex costs and complexity. More details from our patent review are in the data-file.

Plastic recycling: the economics?

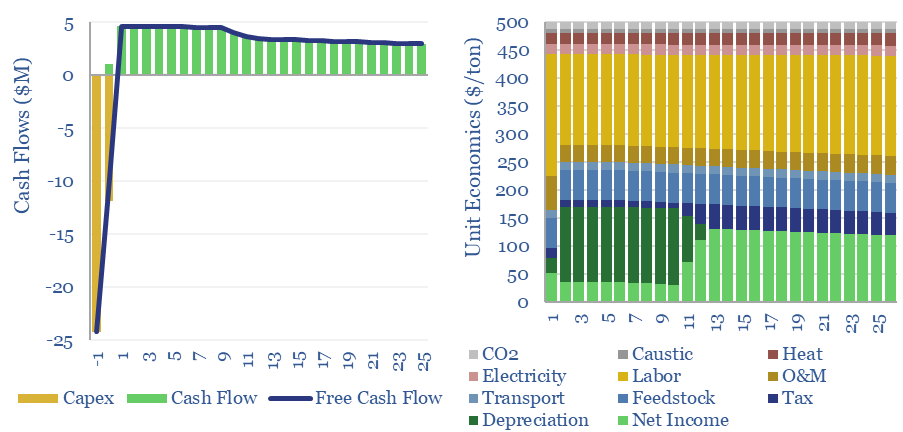
Plastic recycling requires a $500/ton product price, to earn a 10% IRR off of c$1,000/Tpa of up-front capex, at a mechanical recycling facility with 0.3 tons/ton of CO2 intensity (up to 80-90% below virgin plastics, more than we expected). This data-file captures the economics and the costs of plastic recycling, especially for the mechanical recycling of PET.


10% of today’s end-of-life plastic is recycled, or around 40MTpa, within the global plastics industry. Substantively all of this is mechanical recycling, particularly for PET and HDPE, but also to a lesser extent, polypropylene, PVC and to an even lesser extent, polystyrenes.

Mechanical recycling of plastics starts by aggregating plastic waste into bales, transporting to a recycling facility (possibly via truck), then shredding. Next come successive stages of sorting, washing and drying, before clean plastics of the same grade are melted and re-pelletized.

Early sorting stages are aimed at removing paper and dirt, while later stages group plastics of similar optical properties. Washing stages may use caustic soda from the chlor-alkali process. Drying may also be used to char off contaminants.

Capex costs vary, facility-by-facility, but are built up in the data-file via surveying past projects. Energy costs also vary, hence the electricity use of plastic recycling (in kWh/ton) and the heat use (also in kWh/ton) are also built up by surveying technical papers.

The largest opex cost line in the model is labor, due to the need for precise sorting of waste materials. Labor intensity of plastic recycling is based on the disclosures from past projects.

Finally, economics are sensitive to transportation distances. Our model allows for plastic waste to be moved up to 50-miles, however higher prices are needed, for transport over longer distances.

Please download this data-file to stress-test the costs of plastic recycling, by varying the capex, opex, utilization, labor rates, feedstock costs, electricity prices, heat prices, CO2 costs plus taxes and incentives.

In our broader research, we have also explored chemical recycling of plastics, via plastic pyrolysis, and other existing and next-generation recycling technologies. For more on our outlook for polymers, please see our overview of plastics in the energy transition.

Plastic products: energy and CO2 intensity of plastics?

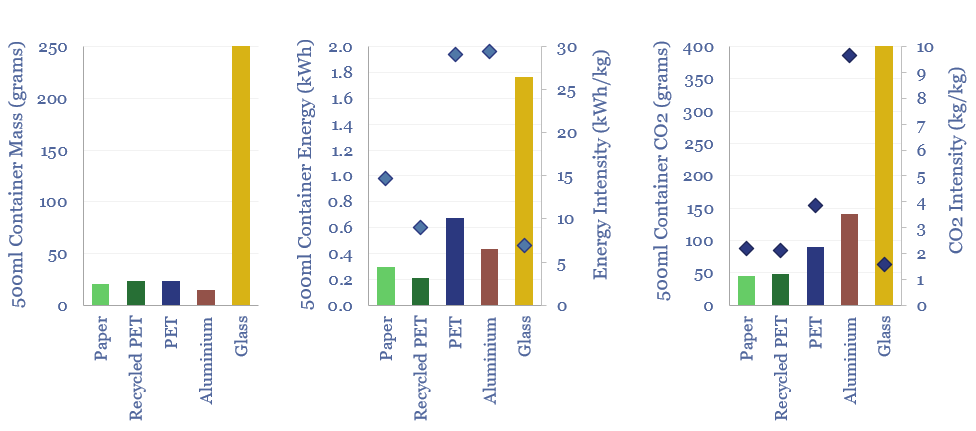
The energy intensity of plastic products and the CO2 intensity of plastics are built up from first principles in this data-file. Virgin plastic typically embeds 3-4 kg/kg of CO2e. But compared against glass, PET bottles embed 60% less energy and 80% less CO2. Compared against virgin PET, recycled PET embeds 70% less energy and 45% less CO2. Aluminium packaging is also highly efficient.


Global plastics production now stands at 500MTpa and will likely rise to 1GTpa by 2050, in our models of global plastics use. So, what is the energy and CO2 intensity of plastics and plastic products?

Answering this question is actually quite complicated. To see why, consider the complexity of the value chain shown below, which captures the PET used in a standard plastic water bottle. Our sense is that there are a lot of LCA studies out there, but most of them are simply guessing at an end number, without doing the necessary work on each step of the process.

Our own attempt, in this data-file, draws from our economic models into oil production, gas production, gas fractionation to ethane, ethane cracking to ethylene, oil refining to naphtha, naphtha cracking to PX, PX oxidation to PTA, make-up methanol solvent, PET production, CO2 intensity of trucking, then additional data are gathered into the production of ethylene oxide, ethylene glycol, condensation polymerization into PET and injection molding into bottles.

It is a wonderfully complex overall-build-up, which makes a mockery of the idea that there is some immutable number for the CO2 intensity of plastics. Clearly, there is scope for variation within all of the industrial processes described above. Nevertheless, we can construct a base case for the energy intensity and CO2 intensity of PET bottles, as a nice case study. And all of the numbers can be varied and stress-tested in the model.

Buildup of CO2 emissions for new PET bottles
Buildup of CO2 emissions for recycled PET bottles

Our conclusion is that a cold, 500ml PET bottle that is pulled out of the fridge and enjoyed contains 23 grams of plastics, embeds 0.7 kWh of primary energy and about 90 grams of CO2. If the same bottle was made from recycled PET, then it would embed 0.2 kWh of energy and 40 grams of CO2. The energy saving is 70%, although the steps of injection molding, transport and refrigeration are common to both processes.

Masses, energy requirements, and CO2 intensities of different beverage packaging types.

Plastic bottles embed 60% less energy and 80% less CO2 than glass bottles, within our build-up, and holding all other variables equal. The key reason is mass. A 500ml PET bottle might weigh 23 grams while a 500ml glass bottle weighs 250 grams, over 10x more. And the deltas would be ever starker with longer transportation distances. Plastic packaging is not the root of all evil!

Aluminium packaging can also be highly energy and CO2-efficient. We have assumed a global average grade of aluminium, embedding about 9 tons of CO2 per ton of aluminium, but note there is also a wide distribution of CO2 intensities among different aluminium producers. But the lowest CO2 and energy use is found for paper packaging.

Granular data are also tabulated on 70 chemicals facilities around the US, using EPA FLIGHT data. Most facilities are not directly comparable. However, we have derived meaningful CO2 intensity data (per ton of product) for c20 of them. We find large and integrated petchem facilities tend to be more efficient (chart below).

Variability in the CO2 intensity of petrochemicals facilities.

Generally, the CO2 intensity of plastic products will run to about 3-4 tons/ton, using other broader-brush build-ups in the data-file, which draw on the reported CO2 emissions from actual petrochemical facilities. Differences are also visible in different plastic products, on one of the model’s tabs (charts below).

Buildup of CO2 emissions from plastics and petrochemical facilities.

Polyurethanes: what upside in energy transition?

Polyurethanes

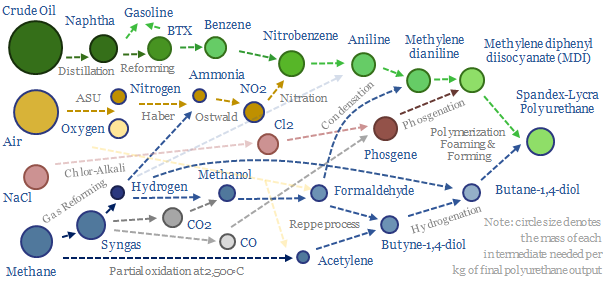
Polyurethanes are elastic polymers, used for insulation, electric vehicles, electronics and apparel. This $75bn pa market expands 3x by 2050. But could energy transition double historically challenging margins, by freeing up feedstock supplies? This 13-page note builds a full mass balance for the 20+ stage polyurethane value chain and screens 20 listed companies.

Propylene oxide: production costs?

Propylene oxide production costs

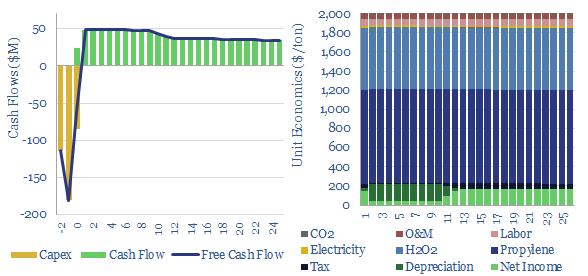
Propylene oxide production costs average $2,000/ton ($2/kg) in order to derive a 10% IRR at a newbuild chemicals plant with $1,500/Tpa in capex. 80% of the costs are propylene and hydrogen peroxide inputs. 60-70% of this $25bn pa market is processed into polyurethanes. CO2 intensity is 2 tons of CO2 per ton of PO today, but there are pathways to absorb CO2 by reaction with PO and possibly even create carbon negative polymers.


Global production of propylene oxide is estimated at 12MTpa in 2022, implying a $25bn pa market at an average propylene oxide cost of $2/kg.

Propylene oxide production costs are modeled in this data-file, and most likely run at $2/kg ($2,000/ton to derive a 10% IRR at a plant costing $1,500/Tpa.

Specifically we have modeled the HPPO process, forming propylene oxide via the exothermic condensation reaction between propylene and hydrogen peroxide, in methanol solvent, catalysed by titanium silicalite (TS-1). Although as noted in the data-file there are alternative production routes, such as the chlorohydrin process and the styrene monomer process PO process. HPPO seems like the front-runner solution for new plants.

Capex costs of propylene oxide plants are estimated based on recent project announcements (chart below). Our base case estimate is $1,500/Tpa of propylene oxide capacity.

Propylene oxide production costs
Capex costs of propylene oxide production facility

Propylene and hydrogen peroxide inputs comprise 80% of the final costs of propylene oxide.

Two thirds of the propylene oxide market today is alkoxylated to form polyols for use as building blocks for polyurethanes.

Vertical integration across petrochemicals? US propylene oxide producers include LyondellBasell (600kTpa at Bayport TX, 550kTpa at Channelview TX), Dow (725kTpa at Freeport TX, 330kTpa at Plaquemine LA) and Huntsman (240kTpa at Port Neches TX).

CO2 intensity of propylene oxide is estimated at 2 tons of CO2 per ton of propylene oxide, which in turn, is largely inherited from the commodity inputs as well. You can stress test this in the data-file.

What is interesting about propylene oxide is the COC epoxide unit is strained, hence it can react with CO2 to form compounds such as propylene polycarbonate (first chart below) or polycarbonate polyols (second chart below). Note that polyurethanes polymerize with diisocyanates to form polyurethanes.

Propylene oxide production costs
Propylene oxide reacts with CO2 to yield polypropylene carbonate
Propylene oxide reacts with CO2 and an OH initiation to yield a polycarbonate polyol which can be a precursor for polyurethanes

In other words, these propylene oxide reaction products can absorb CO2 and prevent its emission into the atmosphere (effectively a type of CCS).

However the maths in the data-file show that propylene carbonate (first chart above) is 57% propylene oxide by mass (gross emissions of 2 tons of CO2 per ton of propylene oxide in our base case) and 43% CO2 (1 ton of CO2 avoided per ton of CO2) and hence while this building block absorbs CO2, it cannot entirely be said to be carbon negative today.

However, the best route to decarbonize propylene oxide is via decarbonizing the hydrogen peroxide inputs using lower-carbon hydrogen. This is also increasingly incentivized by the US IRA. Companies pursuing this CO2-absorbing polyurethanes include Novomer (acquired by Aramco) and Empower Materials.

Please download the data-file to stress test propylene oxide production costs, as a function of propylene prices, hydrogen peroxide prices, capex, opex, electricity, labor costs, O&M costs, CO2 prices and tax rates. Detailed notes are also laid out in the notes tab.

Naphtha cracking: costs of ethylene, propylene and aromatics?

Naphtha cracking costs

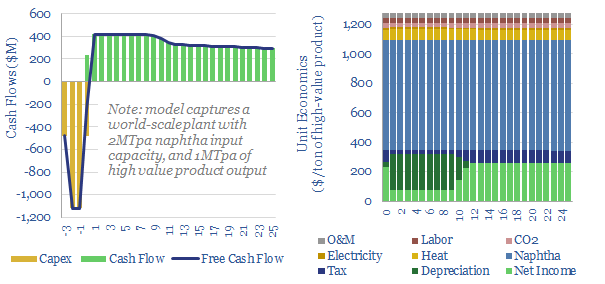
Naphtha cracking costs $1,300/ton for high value products, such as ethylene, propylene, butadiene and BTX aromatics, in order to derive a 10% IRR constructing a new, greenfield naphtha cracker, with $1,600/Tpa capex costs. CO2 intensity averages 1 ton of CO2 per ton of high value products. This data-file captures the economics for naphtha cracking, which matters, as a cornerstone of the modern materials industry.


Naphtha cracking is the dominant source of petrochemical building blocks, especially in Europe and Asia, and a crucial starting point for producing modern polymers, crucial materials, which are needed for consumers and across our energy transition research.

What is naphtha? Naphtha is the C6-C12 fraction from oil refineries, containing molecules with typical boiling points of 60-200ยบC.

What is naphtha cracking? Naphtha is mixed in a 2:1 ratio with steam, super-heated to 700-900โ—ฆC to start “breaking bonds”, then quickly quenched to control the product mix, which is later fractionated.

The purpose of the steam is to minimize coking, which deposits carbon on process units and requires shut-downs for maintenance. A more detailed description of the overall process is laid out in the data-file.

A methodological challenge for appraising the costs of naphtha cracking is the complexity. Around 230 reactions, involving 80 chemical species feature in process sheets.

Our suggestion to simplify the complexity of naphtha cracking is to think about yields as comprising 55-60% olefins (ethylene, propylene, etc), 15-20% fuel gases (which are recirculated and burned to provide heat for the highly endothermic cracking reaction and high-pressure steam), 10% aromatics (BTX), 5% pentanes and hexanes, and 10% heavier fractions which are most likely sent back to adjacent refinery units (chart below).

Naphtha cracking costs
Typical yields of naphtha cracking

For modelling the economics of naphtha cracking, we consider the olefins and aromatics ‘high value’ molecules and they comprise around 65% of the product mix.

Typical capex costs for naphtha crackers run to $1,600/Tpa of input capacity, which equates to $1,700/Tpa of outputs and $2,500/Tpa of high-value outputs (chart below). Underlying details are in the data-file, based on public disclosures from recent projects.

Naphtha cracking costs
Capex costs of naphtha crackers are estimated to average $1,750 per ton pa of inputs

Economics of naphtha cracking. Generating a 10% IRR at a greenfield naphtha cracker requires a high value product price of $1,300/ton. Generally pricing will be highest for butadiene, then propylene and aromatics, and lower for ethylene. Ethylene is also produced via dedicated ethane crackers.

Naphtha cracking cost breakdown? 60% of costs are associated with naphtha inputs, although this depends on the oil price, which can be flexed in the model. In our recent research, we argue that the rise of electric vehicles will dent demand for naphtha more rapidly than other oil fractions, which may lower feedstock costs and boost margins in petrochemicals, especially creating upside for polyurethanes in the energy transition.

Another c10% of naphtha cracking costs are associated with heat, electricity and CO2 prices, which can also be varied in the data-file. Energy costs are quantified from technical papers, across electricity use and heat use, both measured in kWh/ton (or GJ/ton, if you prefer those units).

CO2 intensity is estimated at around 1 ton of CO2 per ton of high value products in our build-up. Some regions have chosen to add higher CO2 prices than others. Some studies that have crossed our desk report higher CO2 intensities, although often this is a definitional issue, as similar CO2 overall emissions get ascribed to different products (e.g., should CO2 be ascribed by product mass or product value?).

Some of the leading companies providing naphtha cracking process technologies include Lummus, KBR, Technip Energies, Linde, Axens. A useful table of crackers in Europe is published by Petrochemicals Europe. A listed downstream company in Central Europe is also currently expanding its naphtha cracking capacity.

Crude to chemicals: there will be naphtha?

Oil markets are transitioning, with electric vehicles displacing 20Mbpd of gasoline by 2050, while petrochemical demand rises by almost 10Mbpd. So it is often said oil refiners should ‘become chemicals companies’. It depends. This 18-page report charts petrochemical pathways and sees greater opportunity in chemicals that can absorb surplus BTX.

Newlight AirCarbon: bioplastics breakthrough?

Newlight is a private company, founded in 2003, based in California, aiming to convert (bio-)methane and air into polyhydroxybutyrate (PHB), a type of polyhydroxyalkanoate (PHA), a biodegradable bio-plastic which is marketed as AirCarbon. The product is said to be carbon negative, biodegradable, strong, “never soggy”, dishwasher safe. Our AirCarbon technology review found some good underlying innovations, but was unable to de-risk cost and capex aspirations.


Global plastic demand likely rises from 470MTpa in 2022 to almost 800MTpa by 2050 (model here). Biodegradable bioplastics are a particularly fast-growing segment of the market (overview here).

Hence this data-file presents our conclusions from reviewing patents filed by Newlight, a private company that is commercializing AirCarbon, a biodegradable bioplastic, polyhydroxybutyrate, which is a type of polyhydroxyalkanoate.

What is PHB? Polyhydroxybutyrate is a type of bioplastic produced by micro-organisms (especially methane-consuming bacteria), in response to physiological stress, as a form of energy storage when nutrients are scarce.

Newlight is already delivering AirCarbon to brands such as Nike, Target, Shake Shack, US Foods, H&M, Ben & Jerrys, and hotel chains, from its Eagle 3 demonstration plant, which produced 60M “units” in 2022 (although this might imply relatively small volumes, of around 300Tpa, if we assume a mix of 0.5 gram straws and 10 gram cutlery items?).

Newlight’s goal through 2025+ is to scale up production into the 10s and 100s of kTpa, and displace synthetic plastics, especially in the $140bn pa foodware market, $30bn pa fashion products market, $64bn pa diaper/personal care market and automotive industries.

Does Newlight have a breakthrough technology for PHB production? Producing PHB from methane is complex with over 10 different processing stages. The patents focus particularly upon one stage, which may be a rate limiting stage, enhancing the production of one out of two possible variants of an enzyme. Details, numbers and yields have been gleaned from reviewing Newlight’s patents and are noted in the data-file.

Is PHB carbon negative? Reading between the lines of its patents, we think methane is most likely to be sourced from landfill gas. And the process screens as carbon negative relative to a baseline alternative where the landfill gas or methane was simply vented to the atmosphere. In our view, this is not strictly ‘carbon negative’, but may be ‘Scope 4 negative‘.

What does PHB cost? Attempts to commercialize PHB bioplastics go back to ICI in the 1980s, but have struggled to compete economically. PHAs on the market today tend to have a cost of $2.5 – 6/kg, versus synthetic plastics closer to $1-1.5/kg.

What are the capex costs of producing bioplastics? We would typically assume $1,300/Tpa for an ethane cracker, $1,500/Tpa for an integrated crude to chemicals plant, but think bioplastics plant capex will be in the range of $10,000-50,000/Tpa.

Can we de-risk a breakthrough in our AirCarbon technology review? The purpose of our patent reviews is to use an apples-to-apples framework, to assess whether we can de-risk technologies in our roadmap to net zero. We were not entirely able to de-risk a widespread breakthrough in our AirCarbon technology review, for reasons noted in the data-file.

Acetylene: production costs?

Acetylene production costs are broken down in this data-file, estimated at $1,425/ton for a 10% IRR on a petrochemical facility that partially oxidizes the methane molecule. CO2 intensity is over 3 kg/kg. Up to 12MTpa of acetylene is produced globally for welding and in petrochemicals.


Acetylene is a gas with the composition C2H4 (H-Cโ‰กC-H), formed via three main production pathways, used mostly as a petrochemical feedstock, but also in welding and metal-working. The gas was discovered by Edmund Davy in 1836. However, Walter Reppe (1892-1969) of BASF is considered the founder of modern acetylene chemistry, creating a safe process to handle acetylene at 25 bar pressures..

Market sizing data on the global acetylene market is highly variable, with different commentators reaching starkly different numbers. One reason is that many integrated petrochemical facilities produce their own acetylene on site, and only a small share of production is sold onwards. Upper estimates that have crossed our screen imply around 12MTpa of acetylene production in 2022.

Acetylene use in the petrochemical industry consumes around 70-80% of global market volumes. It is an important gas because the Cโ‰กC triple bond can easily be vinylated to produce H-X compounds. This pathway yields vinyl acetate, acrylonitrile, acetaldehyde and butane-1,4-diol for polyurethanes such as ‘spandex’. BASF discloses that up to 20 processes at Ludwigshafen use acetylene as an input.

Acetylene use in the welding and metal-working industry consume around 20-30% of global market volumes. This is because of acetylene’s combustion properties, forming a very high flame temperature around 3,000โ—ฆC, high enthalpy of combustion of 50 MJ/kg, a fast flame speed of 10-12 m/s versus 2-6 m/s for other gases and a low moisture content in the exhaust gas. Oxy-acetylene flames cut quickly, saving cost. And ferrous metals are often flame hardened, to improve their longevity, which requires a hot and low moisture flame. Although we wonder whether electric arc welding will increasingly displace acetylene.

Production of acetylene occurs via three main pathways. We think the dominant process in the West is partial oxidation of methane, at very hot temperatures, around 2,000-3,000โ—ฆC. Another method purifies acetylene by-products from ethane cracking. A third pathway uses a reaction between calcium carbide and water to form C2H2 and calcium hydroxide.

Acetylene production costs are estimated at $1,425/ton in this data-file, in order to earn a 10% IRR on a large production facility, and after reflecting capex costs, feedstock gas prices, heat, electricity, cryogenic oxygen, opex costs and CO2 prices. Production costs are most sensitive to input gas prices, and recent gas prices from 2022 can result in cash costs around $2,500/ton in Europe, almost 2x normal levels.

Energy intensity is high, as the partial oxidation reaction of methane forms large quantities of CO and water vapor. 3 CH4 + 3 O2 โ†’ C2H2 + CO + 5 H2O, in order to generate high reaction temperatures that yield acetylene. We estimate the CO2 intensity of acetylene production is over 3 tons/ton (Scope 1+2 basis), which flows through to the embedded CO2 intensity of products in downstream value chains.

Companies producing acetylene include many of the usual suspects in chemicals and industrial gases, such as BASF, Linde, Air Products, Air Liquide, Praxair, LyondellBasell, Asia Technical Gas and many Chinese producers. All of our petrochemicals research is summarized here.

Copyright: Thunder Said Energy, 2019-2025.