Semiconductors: outlook in energy transition?

Semiconductors are an energy technology. And they are transforming the future global energy complex, across AI, solar, electric vehicles, LEDs and other new energies. This short article summarizes our outlook for semiconductors in energy transition, the top ten points for decision-makers, and resultant opportunities across our work.


How do semiconductors work? Metals conduct electricity through a sea of delocalized electrons. By contrast, the charge carriers in semiconductors result from doping, bandgaps, the Boltzmann constant and temperatures, which feed Fermi-Dirac distributions, explained from first principles in our 20-page Overview of Semiconductors.

How do semiconductor devices work? Semiconductors can be combined so that one circuit can control another circuit. This is the basis of how computing works. But also in power electronics, MOSFETs are fast-acting digital switches, convert DC to AC in inverters, change voltage levels in DC-DC converters, and beyond.

Never bet against semiconductors!! The computing power of a chip has doubled every 18-24 months for half a century, via Moore’s Law. If you understand Planck’s equation and the Shockley-Quessier limit, then you might reasonably conclude solar efficiency can double again, as the industry transitions to heterojunction solar, then onwards to multi-junction solar, e.g., as discussed in Longi’s patents. This all means semiconductors will end up being the single most world-changing technology category from 1950-2050.

Semiconductors underpin the rise of AI, and comprise 40-50% of the total installed costs of an AI data center. AI has been the most important topic in global energy in 2024. Machine learning hinges on the semiconductors in GPUs. Our key conclusions are discussed in this video, as 150 GW of AI data centers by 2030, will underpin 1,000 TWH of internet energy consumption, in turn boosting demand for gas, gas pipelines, gas turbines, uranium, industrial cooling equipment, fiber optics, and unlocking transformative new technologies including autonomous technologies and robotics.

Semiconductors underpin the rise of solar. Solar semiconductors harness the photovoltaic effect, transforming diffuse sunlight into a direct current, which further semiconductors can invert into an AC current, then further semiconductors can transmit and distribute. Thus solar module makers are screened here. Solar costs will halve again in the next decade and solar generation will grow 15x by 2050, more than any other energy source. Note that an LED, another world-changing technology, is really just a solar module in reverse.

Semiconductors also underpin the rise of electric vehicles, as it is traction inverters that convert the direct current from batteries into high-frequency AC current, to drive electric motors. Similar semiconductors can be used to drive other electric motors c35% more efficiently, which matters for electrifying compressors, for heat pumps, and as motors absorb 15% of all useful global energy. Semis are also crucial for battery charging in EVs.

Semiconductors underpin future world-changers. Just as photovoltaic semiconductors convert light into electricity, thermoelectric semiconductors can convert heat into electricity, via the Seebeck effect, which could be a future world-changer, if efficiency improves from 2-10% today to 15-20% in future, or better (and with an interesting read-across for fuel cells). And could semis also underpin electrochemical DAC?

The supply chain for semiconductors starts with silica mining (350MTpa globally), then production of silicon metal (8.5MTpa globally) in an arc furnace; then 99.999% pure polysilicon (1MTpa globally) via the Siemens process after 80-100 hours at 600-1,100ยฐC; then production of monocrystalline polysilicon via the Czochralski method or Lely process (for SiC). Semiconductor devices are then manufactured via masking, etching and vapor deposition to deposit nm-ฮผm thick layers of ultra-pure materials, under 1 millionth of an atmosphere of pressure, which also pulls on demand for vacuum pumps.

Materials implications can be seen in the bill of materials for electronic devices. Semiconductors are really not very good conductors, even when doped (remaining 10,000x more resistive than metals), which is why a solar panel contains more copper than silicon, and digitization inextricably boosts copper demand and aluminium demand, as well as advanced polymers. Other interesting materials exposures include indium, tin and industrial gases.

Specific companies commercializing next-gen semiconductors have also been screened in our research, including wide-bandgap semiconductors such as 1-10% more efficient Silicon Carbide (SiC) (economic model here) and MOSFET manufacturers, LED lighting companies, B-TRANs from Ideal Power to improve EV efficiency, soft-switching specialists such as Hillcrest, and LPUs from Groq that could partly compete with NVIDIA’s GPUs.


Groq: AI inference breakthrough?

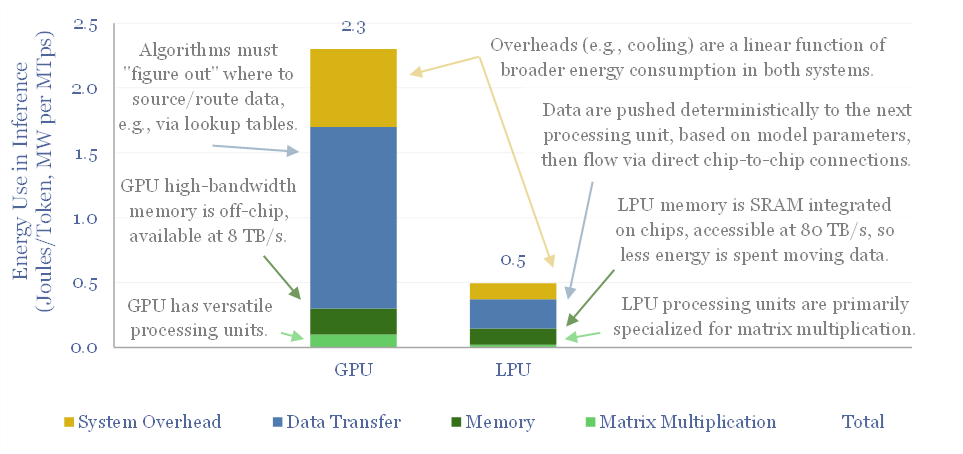
Comparison of GPU and LPU energy use. LPUs could be 4.5x more efficient

Groq has developed LPUs for AI inference, which are up to 10x faster and 80-90% more energy efficient than todayโ€™s GPUs. This 8-page Groq technology review assesses its patent moat, LPU costs, implications for our AI energy models, and whether Groq could ever dethrone NVIDIAโ€™s GPUs?


Groq is a private company, founded in 2018, with 250 employees, based in Mountain View, California, founded by ex-Google engineers. The company raised a $200M Series C in 2021 and a $640M Series D in August-2024, which valued it at $2.8bn.  

The Groq LPU is already in use, by “leading chat agents, robotics, FinTech, and national labs for research and enterprise applications”. You can try out Meta’s Llama3-8b running on Groq LPUs here.

Groq is developing AI inference engines, called Language Processing Units (LPUs), which are importantly different from the GPUs. The key differences are outlined in this report, on pages 2-3.

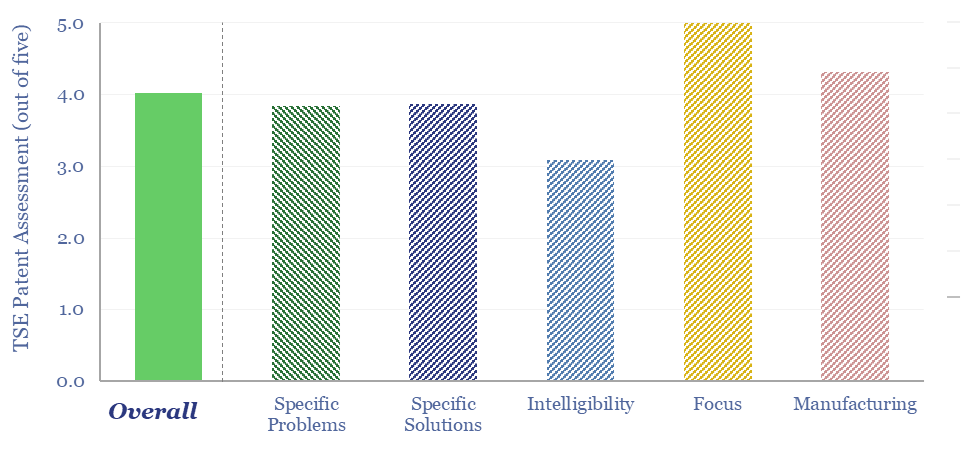
Across our research, we have generally used a five-point framework, in order to determine which technologies we can start de-risking in our energy transition models. For Groq, we found 46 patent families, and reviewed ten (chart below). Our findings are on pages 4-5.

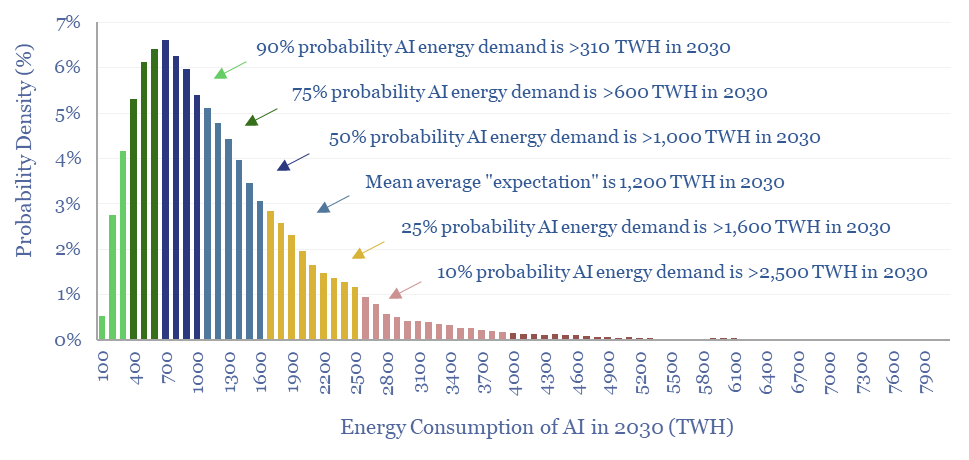
Our latest published models for the energy consumption of AI assumed an additional 1,000 TWH of electricity use by 2030, within a possible range of 300 – 3,000 TWH based on taking the energy consumption of computing back to first principles. Groq’s impact on these numbers is discussed on pages 6-7.

NVIDIA is currently the world leader in GPUs underlying the AI revolution, which in turn underpins its enormous $3.6 trn of market cap at the time of writing. Hence could Groq displace or even dethrone NVIDIA, by analogy to other technologies we have seen (e.g., the shift from NMC to LFP in batteries). Our observations are on page 8.

For our outlook on AI in the energy transition, please see the video below, which summarizes some of the findings across our research in 2024.

Commodity prices: metals, materials and chemicals?

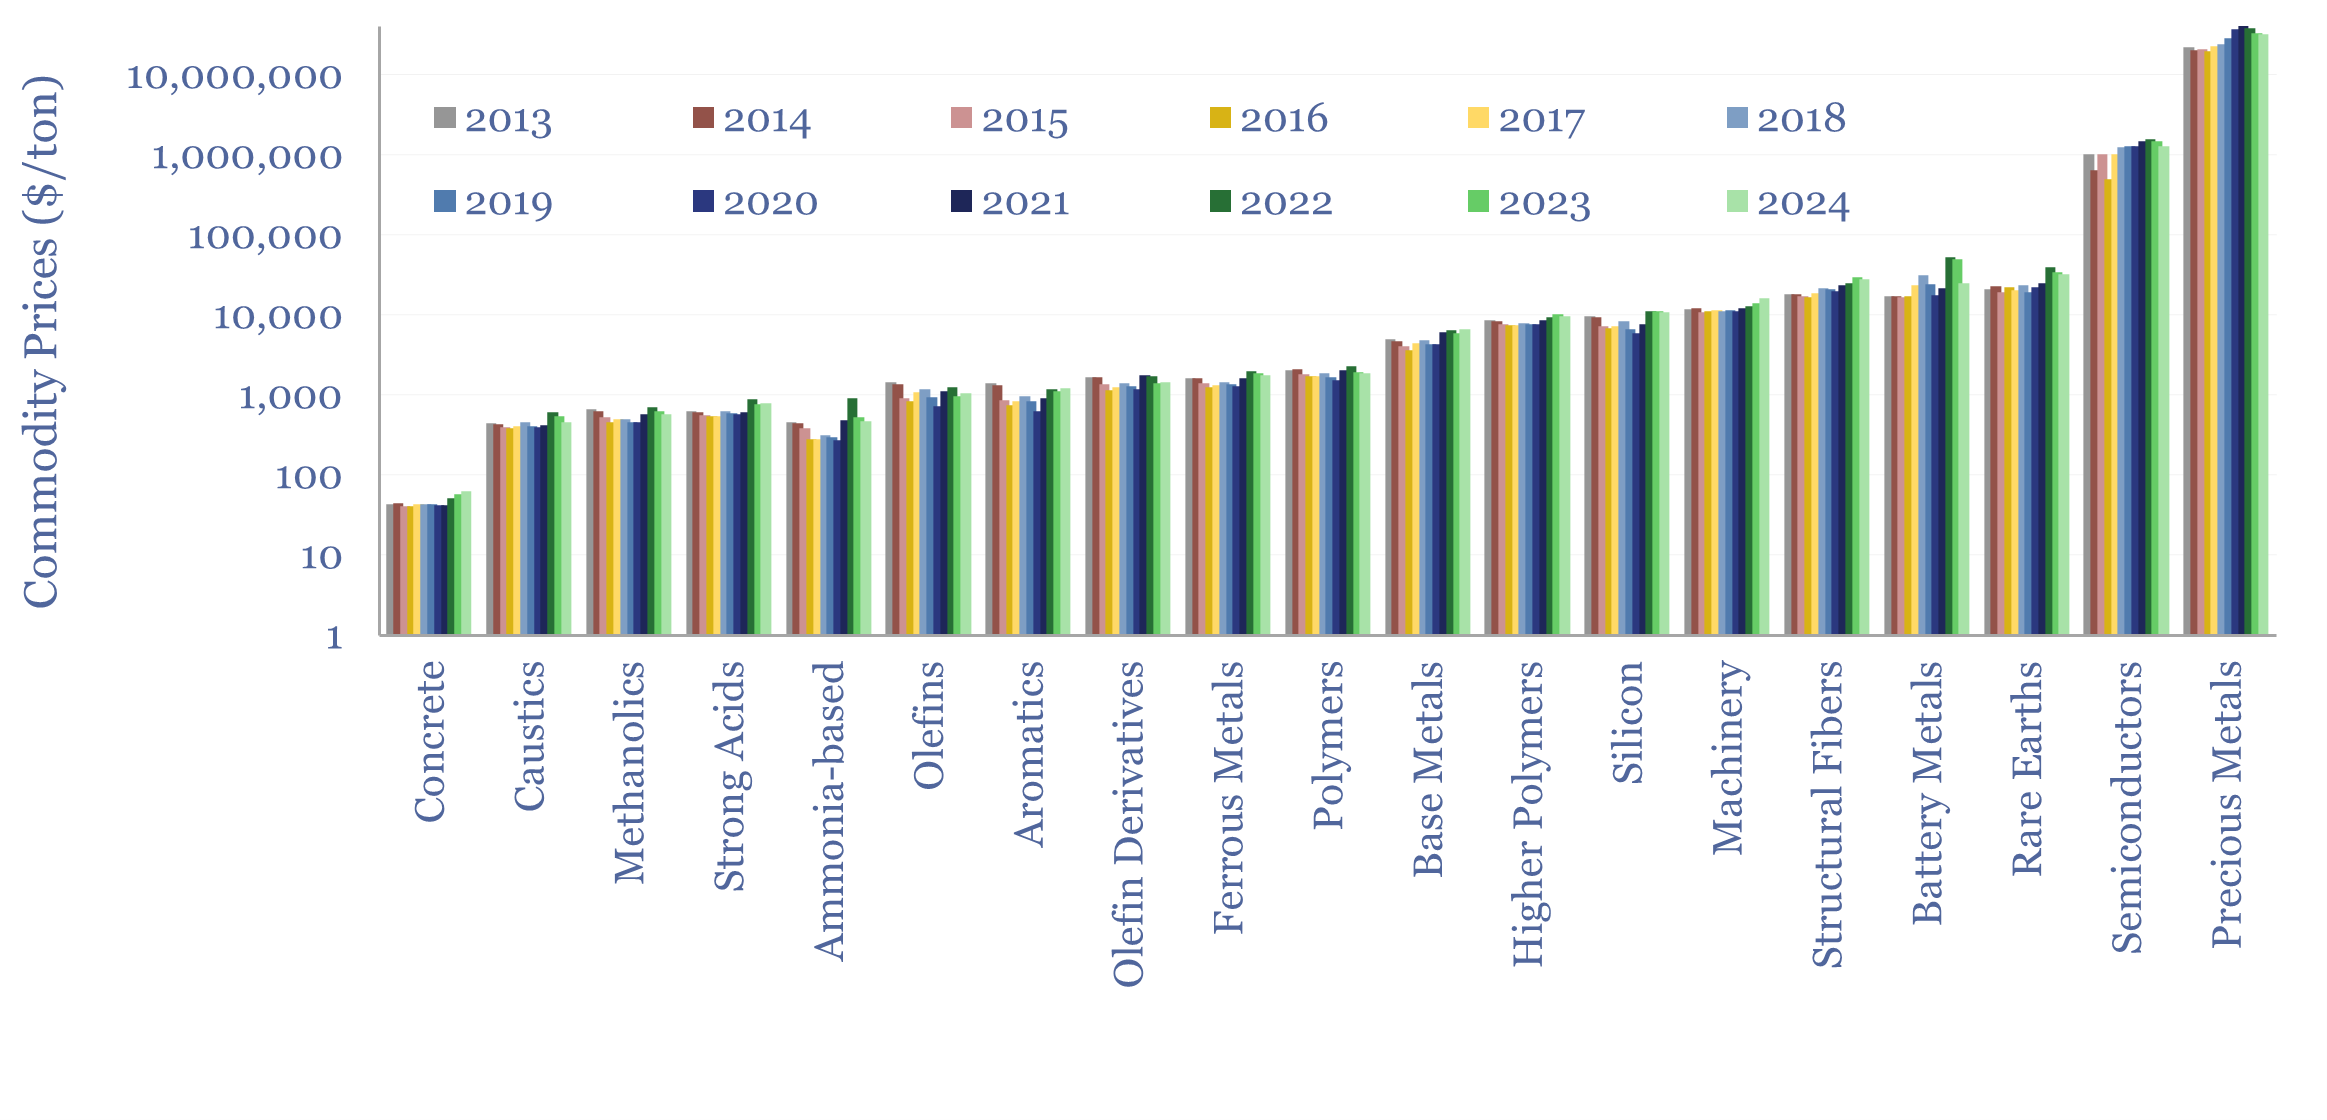
Annual commodity prices are tabulated in this database for 70 material commodities, as a useful reference file; covering steel prices, other metal prices, chemicals prices, polymer prices, with data going back to 2012, all compared in $/ton. 2022 was a record year for commodities. We have updated the data-file for 2023 data in March-2024.


Material commodity prices flow into the costs of producing substantively everything consumed by human civilization, and increasingly consumed as part of the energy transition. Hence this database of annual commodity prices is intended as a useful reference file. Note it only covers metals, materials and chemicals. Energy commodities and agricultural commodities are covered in other TSE data-files.

Source and methodology. The underlying source for this commodity price database is the UN’s Comtrade. This useful resource covers trade between all UN member countries, across thousands of categories, in both value terms ($) and mass terms (kg). Dividing values (in $) by masses (in kg) yields an effective price (in $/kg or $/ton). We have then aggregated, cleaned and averaged the data for 70 materials commodities.

The median commodity in the data-file costs $2,500/ton on an unweighted basis. Although this ranges from $20/ton for aggregates to $75M per ton for palladium metal.

2022 was a record year for material commodity prices. The average material commodity priced 25% above its 10-year average and 40 of the 70 commodities in the database made 10-year highs.

Steel prices reached ten-year highs in 2022, averaging $2,000/ton across the different steel grades that are assessed in the data-file. This matters as 2GTpa of steel form one of the most important underpinnings in all global construction. Our steel research is aggregated here.

Commodity prices
Steel Price by year by steel grade in $ per ton

Base metal prices averaged 40% above their ten-year averages in 2022, as internationally traded prices rose sharply for nickel, rose modestly for aluminium and zinc, and remained high for copper (chart below).

Commodity prices
Base metal prices by year and over time for zinc, aluminium, copper, and nickel in $ per ton

Battery metals and materials prices rose most explosively in 2022, due to bottlenecks in lithium, cobalt, nickel and graphite. This is motivating a shift in battery chemistries, both for vehicles and for energy storage. It also means that the average battery material in our data-file was higher priced than the average Rare Earth metal in the data-file (which is unusual, but not the first time).

Commodity prices
Battery material prices over time $ per ton for lithium, cobalt, manganese, nickel, LiPF6 and lithium carbonate in $ per ton

Commodity chemicals all rose in 2022 across every category tracked in our chart below. These chemicals matter as intermediates. On average, sodium hydroxide prices reached $665/ton in 2022, sulphuric acid prices reached $140/ton and nitric acid prices reached $440/ton.

Commodity prices
Industrial Acids and Caustic Soda Prices over time. NaH, H2O2, HCl, H2SO4 Sulfuric Acid, HNO3 Nitric Acid, H3PO4 Phosphoric Acid, HCN and HF in $ per ton

500MTpa of global plastics and polymers demand is covered in our plastics demand database. Both finished polymer prices (first chart) and underlying olefins and aromatics (as produced by naphtha crackers, second chart) prices rose sharply in 2022. Our recent research has wondered whether terms of trade are likely to become particularly constructive for polyurethanes.

Commodity prices
Polymer prices by year LDPE HDPE PET EVA Polyurethanes Paints and Adhesives in $ per ton
Commodity prices
Olefins and Aromatics Prices over time

Silicon prices matter as they feed in to the costs of solar, and traded silicon prices also reached ten year highs in 2022, before correcting sharply in 2023. Silica prices surpassed $70/ton, silicon metal prices reached $4,000/ton and polysilicon prices surpassed $30/kg (charts below).

Commodity prices
Silica price, silicon price and polysilicon price in $ per ton

The full database captures 70 globally traded materials commodities and their annual prices over time in $/ton, year by year, from 2012-2022. These are: Acrylonitrile prices, Adhesives prices, Aggregates prices, Aluminium prices, Ammonia prices, Battery Graphite prices, Benzene prices, Butadiene prices, Carbon Fiber prices, Cement prices, Cobalt prices, Cobalt Oxide prices, Cold Rolled Steel prices, Concrete prices, Copper prices, Copper Wire prices, Cumene prices, Electric Motor and Generator prices, Electrical Transformer prices, Epoxide prices, Ethanol prices, Ethylene prices, Ethylene Oxide prices, EVA prices, Formaldehyde prices, Glass Fiber prices, Gold prices, Graphite Anode prices, Graphite paste prices, HCl prices, HDPE prices, HF prices, Hot Rolled Steel prices, Hydrogen Peroxide prices, Integrated Circuit prices, LDPE prices, LiPF6 prices, Lithium Carbonate prices, Lithium Metal prices, Manganese prices, Manganese Oxide prices, Methanol prices, NaCN prices, Nickel prices, Nitric Acid prices, Paint prices, Palladium prices, PET prices, Phosphoric Acid prices, Platinum prices, Polyethylene prices, Polysilicon prices, Polyurethane prices, Propylene prices, Propylene Oxide prices, PTFE prices, Rare Earth Magnet prices, Scandium & Yttrium prices, Silica prices, Silicon Metal prices, Silver prices, Sodium Hydroxide prices, Stainless Steel prices, Steel Alloy prices, Sulfuric Acid prices, Toluene prices, Tubular Steel prices, Urea prices, Vehicle prices, Xylene prices, Zinc prices.

Oscar Wilde noted that the cynic is the man who knows the price of everything, but the value of nothing. To avoid falling into this trap, we also have economic models for most of the commodities in this commodity price database.

We will continue adding to this commodity price database amidst our ongoing research. You may find our template useful for running Comtrade queries of your own. Or alternatively, if you are a TSE subscription client and we can help you to use this useful resource, then please do email us any time.

Ideal Power: Bi-Directional Bipolar Junction Transistors?

Bi-Directional Bipolar Junction Transistors are an emerging category of semiconductor-based switching device, that can achieve lower on-state voltage drops than MOSFETs and softer, faster switching than IGBTs, to improve efficiency and lower component count in bi-directional power converters. This data-file screens B-TRAN patents from Ideal Power.


LFP batteries are 20% lower-cost than NMC, and as low as $50-60/kWh in China in 2024, per our recent research note into the rise of LFP. But they are also 15% less energy-dense, which reduces the range of electric vehicles. So could range be restored by improving electronics?

Ideal Power is a small-cap US company, commercializing bi-directional junction transistors (B-TRANs), with ultra-low voltage drops in their on-state (better than a MOSFET) and soft-switching even amidst rapid switching (better than IGBTs). The company states that this could improve electric vehicle efficiency by 7-10%.

Ideal Power’s patent library was high-quality, based on using the usual criteria in our patent-based technology assessments, with over 60 Patent Families in EspaceNet, mostly optimizing the performance of BTRANs, securing a moat around the technology.

Several patents specifically addressed the optimization of these devices, challenges that have been encountered and overcome, and the manufacturing of double-sided semiconductors, in an industry that has historically only fabricated components on the front side of chips.

How does a bi-directional bipolar junction transistor work? We have pieced together the diagram below from Ideal Power’s disclosures.

Schematic of a bi-directional bipolar junction transistor

Key challenges that stood out to us, with Ideal Power’s bi-directional bipolar junction transistors, are noted in the data-file.

For helpful background into how semiconductors work, which may be useful context alongside this review, please see our overview of semiconductor physics.

Energy intensity of AI: chomping at the bit?

Rising energy demands of AI are now the biggest uncertainty in all of global energy. To understand why, this 17-page note is an overview of AI computing from first principles, across transistors, DRAM, GPUs and deep learning. GPU efficiency will inevitably increase, but compute increases faster. AI most likely uses 300-2,500 TWH in 2030, with a base case of 1,000 TWH.

Bill of materials: electronic devices and data-centers?

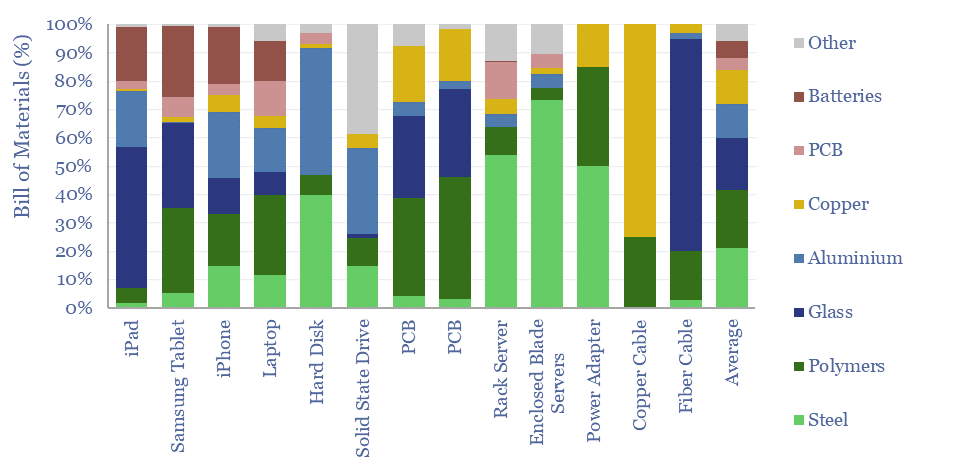
Electronic devices are changing the world, from portable electronics to AI data centers. Hence what materials are used in electronic devices, as percentage of mass, and in kg/kW terms? This data-file tabulates the bill of materials, for different devices, across different studies.


This data-file captures the bill of materials for electronic devices, such as cell phones, tablets, laptops, hard discs, solid state-drives, printed circuit boards, servers in data-centers, power supply units, adapters, copper cables and fiber optic cables.

Five materials make up c85% of the mass of typical electronic devices: advanced polymers (c20%), steel (c20%), glass (18%), aluminium (12%) and copper (12%). However, the exact numbers vary by product, as shown in the chart above.

Steel is the joint largest material exposure for electronic devices, although this is unsurprising, as steel is the most-used structural material on the planet, and in digital devices as well, it is used for the chassis/enclosure of data-center racks and other components, in switchgears, fans, heat sinks, etc.

Advanced polymers are the single most important material, both by mass and by specialization. HDPE and PVC are often used for electrical insulation in wires, cables and power supply units. PCBs are c35% epoxy resin. Polycarbonates are used in hard drives and optical disc drives. Solid state drives use specialty polymers, such as liquid crystal polymers.

Copper use from the rise of AI is more debatable. For example, several older studies suggest copper use in AI data-centers can range from 30-60 tons/MW. But on the other hand, these older studies may not fully reflect the scale-up of computing density per rack, which could reduce copper use to 10 tons/MW, albeit this would still tighten global copper balances by around 1% per year through 2030.

The ability to thrift out bulk material intensity factors by raising computing performance density, using advanced materials and manufacturing techniques is highly reminiscent of the same trend in new energies (raising solar efficiency, raising battery voltages). This creates opportunities in vapor deposition equipment, advanced polymers, and ultra-high purity materials including tantalum, silver, gold, tin, et al.

Finally, the vast range of advanced materials used in electronic devices and data-center components is shown by the vast number of materials in the data-file: ABS, Al2O3, Aluminium, Barium, Barium Titanate, Benzoic acid polymer, Brass, Calcium Oxide, Carbon, Cardboard, Chromium, Copper, Cromium, Dioxygen, Epoxy Resin, Ethylene Vinyl Acetate, Fan, Ferrous, Fibrous Glass Wool, Glass, Glass Fiber, Gold, HDPE, HVA-2, Iron, Iron Oxide, LCP Polymer, Lead, Li-ion batteries, Magnesium silicate, Magnesium, Magnets, Manganese, Neodymium, Nickel, Palladium, Paper, PCB, Pegoterate, Phenol polymer, Pigment Black 28, Polybutyl Terephthalate, Polycarbonate, Polycarbonate Acrylonitrile, Polycarbonates, Polyimides, Polymers, Polyurethanes, Proprietary, PVC, Silica, Silicon, Silver, Sodium Oxide, Solder, Steel, Styrofoam, Synthetic Rubber, Tantalum, Tin, Titanium, Vinyl Silicone Oil, Zinc.

Energy and AI: the power and the glory? ย 

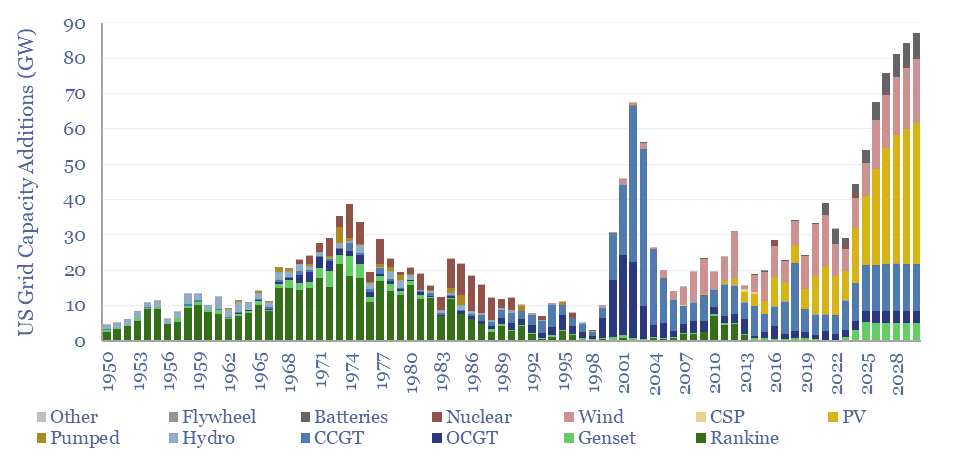
The power demands of AI will contribute to the largest growth of new generation capacity in history. This 18-page note evaluates the power implications of AI data-centers. Reliability is crucial. Gas demand grows. Annual sales of CCGTs and back-up gensets in the US both rise by 2.5x?

Data-centers: the economics?

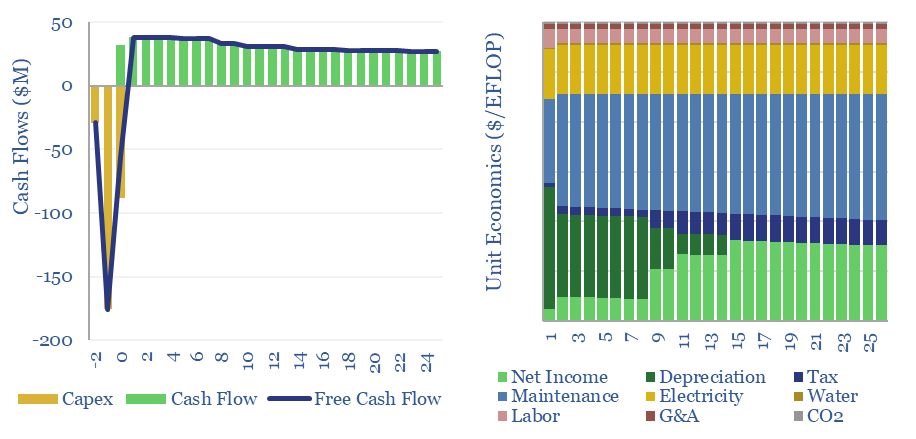
Financial model over 25 years for a model data-center.

The capex costs of data-centers are typically $10M/MW, with opex costs dominated by maintenance (c40%), electricity (c15-25%), labor, water, G&A and other. A 30MW data-center must generate $100M of revenues for a 10% IRR, while an AI data-center in 2024 may need to charge $3M/EFLOP of compute.


Data-centers underpin the rise of the internet and the rise of AI, hence this model captures the costs of data-centers, from first principles, across capex, opex, land use and other input variables (see below).

In 2023, the global data-center industry is $250bn, across 500 large facilities, 20,000 total facilities, and around 40 GW of capacity, which likely rises by 2-5x by 2030.

A 30MW mid-scale data-center, costing $10M/MW of capex, must generate $100M pa of revenues, in order to earn a 10% IRR, after deducting electricity costs and maintenance.

The capex breakdown for a typical non-AI data center is built up in the data-file, drawing on cost data for various IT components, cooling, chillers, transformers, switchgear, battery UPS, backup generators, plus broader infrastructure such as generation, transmission and fiber links.

Capex buildup for a data-center. The cost is $10,000/kW, with the largest parts being the servers, cabling and installation. Another roughly $2,000/kW comes from associated infrastructure.

If the data-center is computation heavy, e.g., for AI applications, this might equate to a cost of around $3/EFLOP of compute in 2023. This fits with disclosures from OpenAI, stating that training GPT 4 had a total compute of 60M EFLOPs and a training cost of around $160M.

However, new generations of chips from NVIDIA will increase the proportionate hardware costs and may lower the proportionate energy costs (see ComputePerformance tab). An AI-enabled data-center can easily cost 2x more than a conventional one, surpassing $20M/MW.

Reliability is also crucial to the economics of data-centers: uptime and utilization have a 5x higher impact on overall economics than electricity prices. This makes it less likely that AI data-centers will be demand-flexed to power them using the raw output from renewable electricity sources, such as wind and solar?

The cost of training AI depending on the price of electricity and data-center utilization. The price is more sensitive to utilization than to power prices.

Economic considerations may tip the market towards sourcing the most reliable power possible, especially amidst grid bottlenecks, and it also explains the routine use of backup power generation.

Another major theme is the growing power density per rack, rising from 4-10kW to >100kW, and requiring closed-loop liquid cooling.

Please download the data-file to stress-test the costs of a data-center, performance of an AI data-center, and we will also continue adding to this model over time. Notes from recent technical papers are in the final tab.

Internet energy consumption: data, models, forecasts?

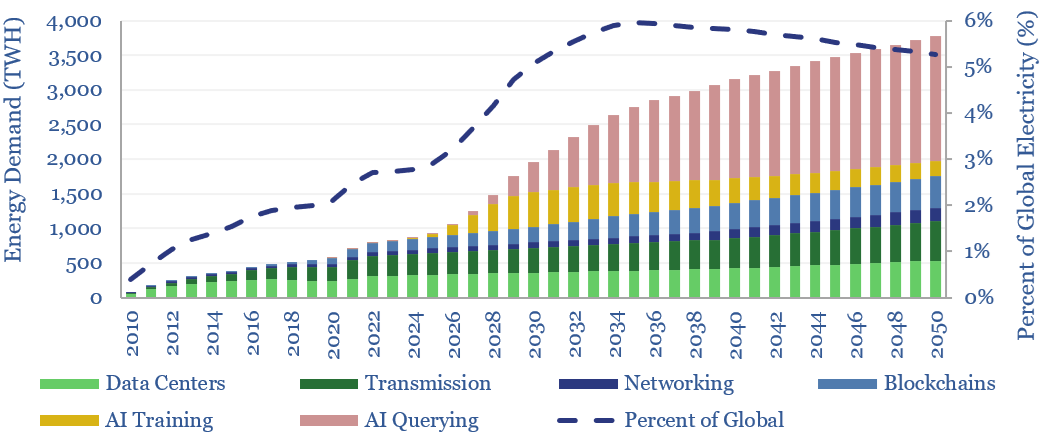
This data-file forecasts the energy consumption of the internet, rising from 800 TWH in 2022 to 2,000 TWH in 2030 and 3,750 TWH by 2050. The main driver is the energy consumption of AI, plus blockchains, rising traffic, and offset by rising efficiency. Input assumptions to the model can be flexed. Underlying data are from technical papers.


Our best estimate is that the internet accounted for 800 TWH of global electricity in 2022, which is 2.5% of all global electricity. Despite this area being a kind of analytical minefield, we have attempted to construct a simple model for the future energy demands of the internet, which decision-makers can flex, based on data and assumptions (chart below).

Internet traffic has been rising at a CAGR of 30%, as shown by the data use of developed world households, rising to almost 3 TB per user per year by 2023. The scatter also shows a common theme in this data-file, which is that different estimates from different sources can vary widely.

Future internet traffic is likely to continue rising. By 2022 there were 5bn global internet users underpinning 4.7 Zettabytes (ZB) of internet traffic. Users will grow. Traffic per user will likely grow. We have pencilled in some estimates, but uncertainty is high.

TSE's estimates for future numbers of internet users, data traffic per user, and total data traffic.

The energy intensity of internet traffic spans across data-centers, transmission networks and local networking equipment. Again, different estimates from different technical papers can vary by an order of magnitude. But a first general rule is that the numbers have declined sharply, sometimes halving every 2-3 years.

Electricity use of data centers, data transmission, and local network systems from 2009 to 2023.

The current energy intensity of the internet is thus estimated at 140 Wh/GB in our base case, broken down in the waterfall chart below, using our findings from technical papers and the spec sheets of underlying products (e.g., offered by companies such as Dell).

Energy intensity of internet processes will almost certainly decline in the future, as traffic volumes rise. Again, we have pencilled in some estimates to our models, which can be flexed.

However the energy needed for AI is now rising exponentially. Training Chat GPT-3 in 2020 used 1.3 GWH to absorb 175bn parameters. But training chat GPT-4 in 2023ย used 50 GWH to absorb 1.8trn parameters.ย We find a 98% correlation between AI training energy and the total compute during training.

AI querying energy is also correlated with the complexity of the AI model, and thus will likely continue rising in the future. Average energy use is estimated at 3.6 Wh per query today, which is 4x more than an email (1 Wh) and 10x more than a google search (0.3 Wh).

Muting the impacts of larger data-processing volumes, we expect a 40x increase in future computer performance in GFLOPS per Watt (chart below). This yields 900 TWH of AI demand around 2030, revised up from 500 TWH in April-2023 (chart above).

Please download the model to stress-test your own estimates for the energy intensity of the internet. It is not impossible for total electricity demand to ‘go sideways’ (i.e., it does not increase). It is also possible for the electricity demand of the internet to exceed our estimates by a factor of 2-3x if the pace of productivity improvements slows down.

Vapor deposition: leading companies?

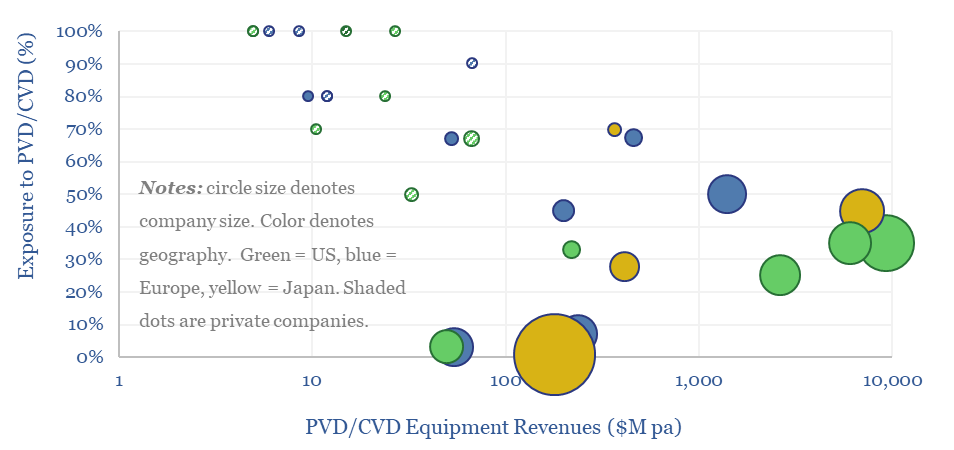
Leading vapor deposition companies by their revenue in 2023 and exposure to the PVD/CVD market.

This data-file is a screen of leading companies in vapor deposition, manufacturing the key equipment for making PV silicon, solar, AI chips and LED lighting solutions. The market for vapor deposition equipment is worth $50bn pa and growing at 8% per year. Who stands out?


Vapor deposition uses 250-1,250ยบC temperatures and vacuums as low as 1 millionth of an atmosphere, to deposit nm-ฮผm thick layers of ultra-pure materials onto semiconductor and solar substrates, to make PV silicon, solar modules, computer chips, AI chips, LEDs, plus for hardened metals, cutting tools, insulated glass and aluminized food packaging.

We figured that we needed to compile this screen after reviewing LONGi‘s patents in early-2024. The technology underpinning HJTs and TOPCON modules is very clever, but it is clear from the patents, that it all relies upon vapor deposition. Hence who are the crucial shovel-makers here?

Half of the $50bn pa market is dominated by five public companies with 25-50% exposure to vapor deposition and c30% EBIT margins, based on our screen of leading companies in vapor deposition.

In overall Semiconductor Production equipment, the world leader is Applied Materials, which is based in the US, produces vapor deposition for the solar industry plus for the ‘angstrom era’ of chips, and has $170bn of market cap, more than Schlumberger, Baker Hughes and Halliburton combined.

In chemical vapor deposition for the semiconductor industry, a large Japanese company stood out, claiming 43% market share, and also the only integrated product suite covering the four sequential processes of deposition, coating/developing, etching and cleaning.

In the $700M niche of Metal Organic CVD, as used to make 70% of LEDs globally, but also for wide-bandgap semiconductors, such as SiC and GaN, the market leader is a publicly listed German specialist, with 70% market share.

In laser annealing, which can modify chemical properties over 10-100nm within nanoseconds, for making AI chips, a US-listed specialist stood out as a leader, and it also has a well-regarded ion beam deposition line, seen as a successor to PVD as it achieves larger and uniformly deposited grains.

Our experience as energy analysts has been that companies in the semiconductor supply chain are now just as relevant to the future of global energy as those in the subsea supply chain. Hence over time we will add to this screen of leading companies in vapor deposition.

Copyright: Thunder Said Energy, 2019-2024.