Vehicles
-
Container freight: shipping economics?
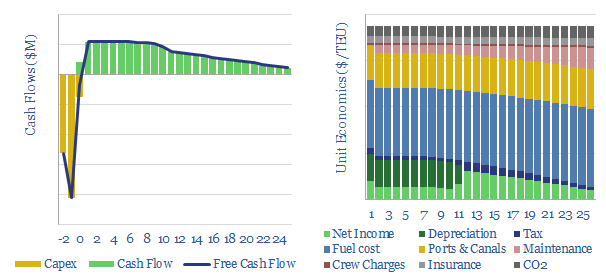
This data-file models the total costs of shipping a container c10,000 nautical miles from China to the West, in a 20,000 TEU vessel. Emerging fuels can lower the CO2 intensity of shipping from their baseline of 0.15kg/TEU-mile, by 60-90%, but freight costs inflate by 30%-3x.
-
Mapping vehicle value chains?
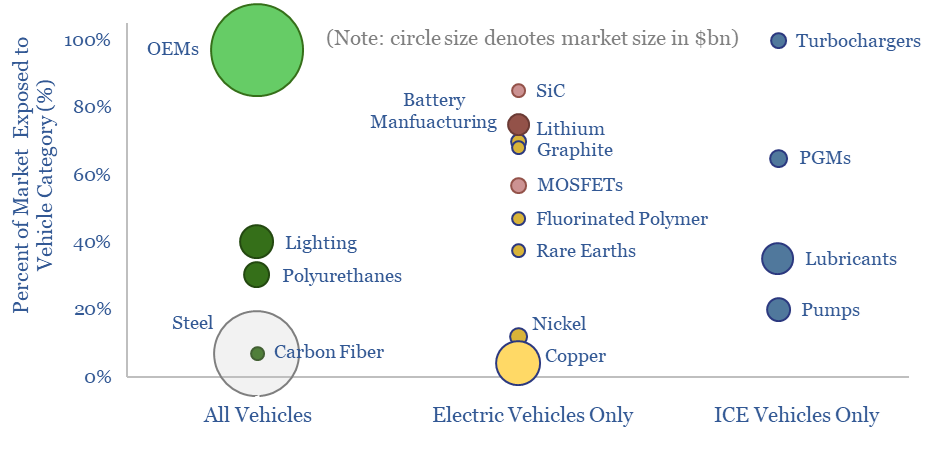
Who is impacted if vehicle sales, EVs or ICE volumes surprise? Autos are a $2.7 trn pa global market, a vast 2.5% of global GDP. 15% is gross margin for OEMs. The other 85% is spread across metals, materials and capital goods. Hence this 14-page note highlights 200 companies from our database of 1,500 companies.…
-
Going platinum: PGMs in energy transition?
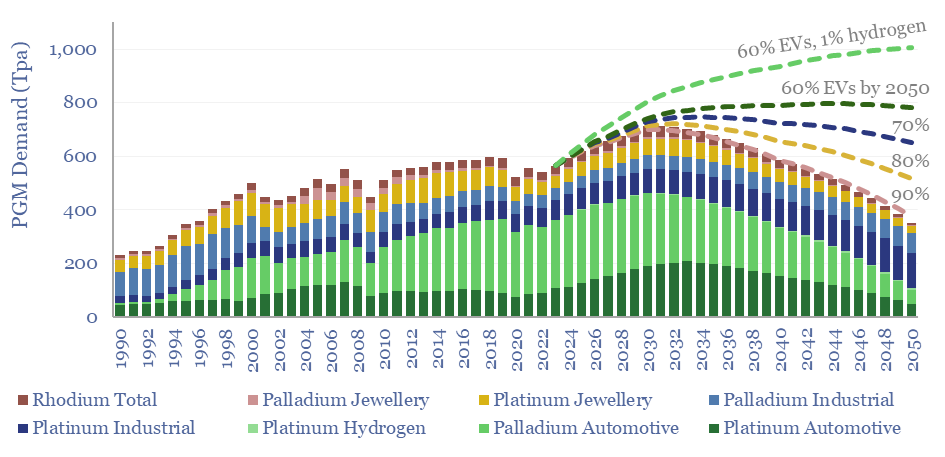
Could PGMs experience another up-cycle through 2030, on more muted EV sales growth in 2025-30, and rising catalyst loadings per ICE vehicle? This 16-page note explores global supply chains for platinum and palladium, the long-term demand drivers for PGMs in energy transition, and profiles leading PGM producers.
-
Vehicle emissions of CO, NOx and HCs?
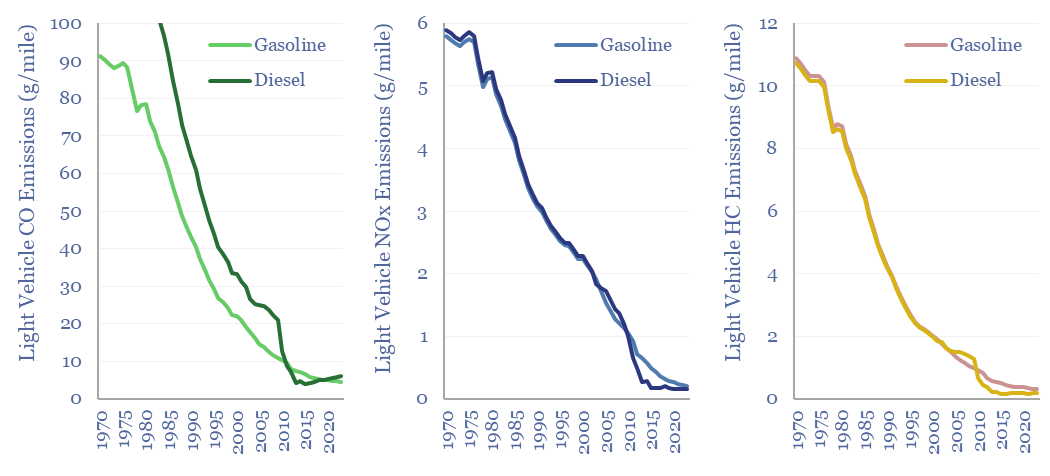
There has been a remarkable reduction in the negative air quality impacts of combustion vehicles since 1970, as quantified in this data-file and over time. Vehicle emissions of CO, NOx and HCs have all fallen by 20-60x over the past 50-years, to 5 grams/mile, 0.2 grams/mile and 0.3 grams per mile, respectively.
-
Lithium ion battery costs: materials and manufacturing?
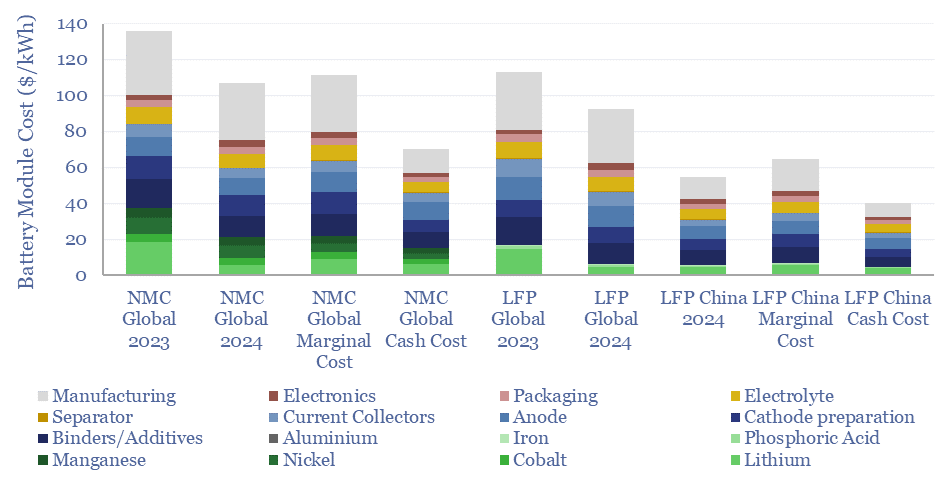
Lithium ion battery costs range from $40-140/kWh, depending on the chemistry (LFP vs NMC), geography (China vs the West) and cost basis (cash cost, marginal cost and actual pricing). This data-file is a breakdown of lithium ion battery costs, across c15 materials and c20 manufacturing stages, so input assumptions can be stress-tested.
-
Electric vehicles: the road to cost parity?
Could electric vehicles deflate towards cost parity with ICEs in 2025-30, helping to re-accelerate EV adoption? This 13-page report contains a granular sum-of-the-parts cost breakdown for EVs vs ICEs. Then we consider battery deflation, power train deflation, small urban EVs, tax incentives, and the representativeness of low-cost Chinese EVs.
-
Vehicle depreciation rates: EVs versus ICEs?
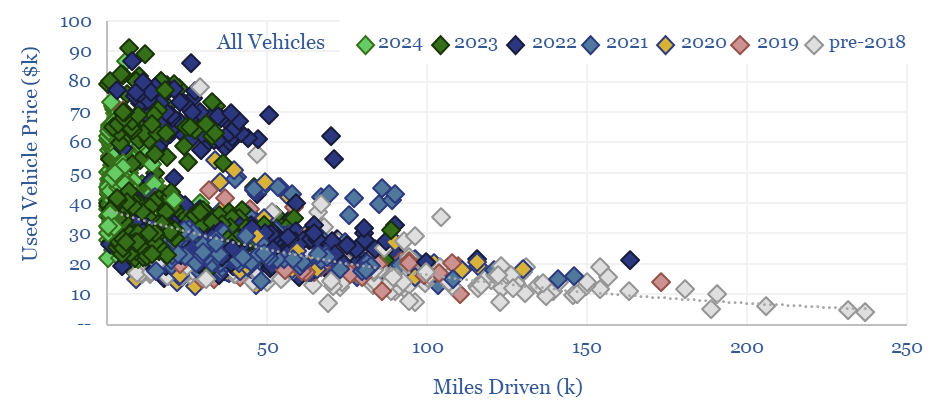
This data-file quantifies the cost per mile of vehicle ownership across different categories by correlating second hand car prices with their accumulated mileage. Hybrids and regular passenger cars are most economical. SUVs and EVs are 2x more expensive. Hydrogen vehicles depreciate fastest and will have lost over 90% of their value after 100,000 miles.
-
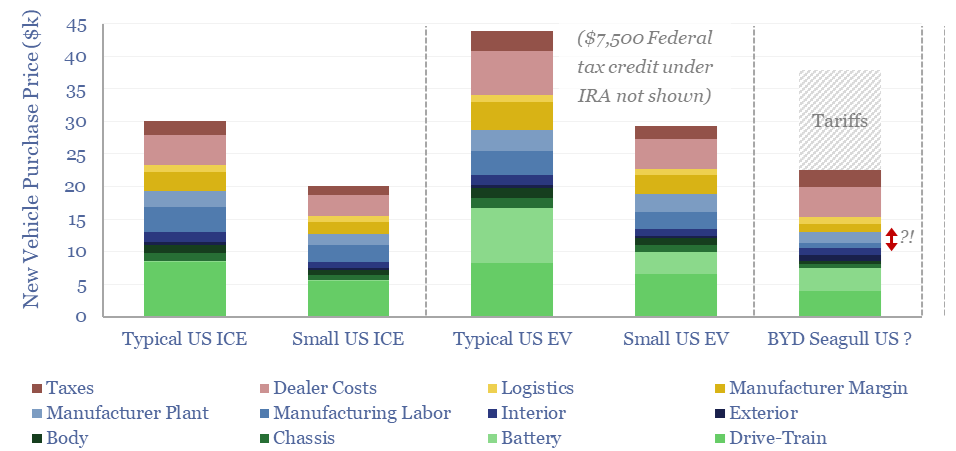
Electric vehicle cost breakdown by component?
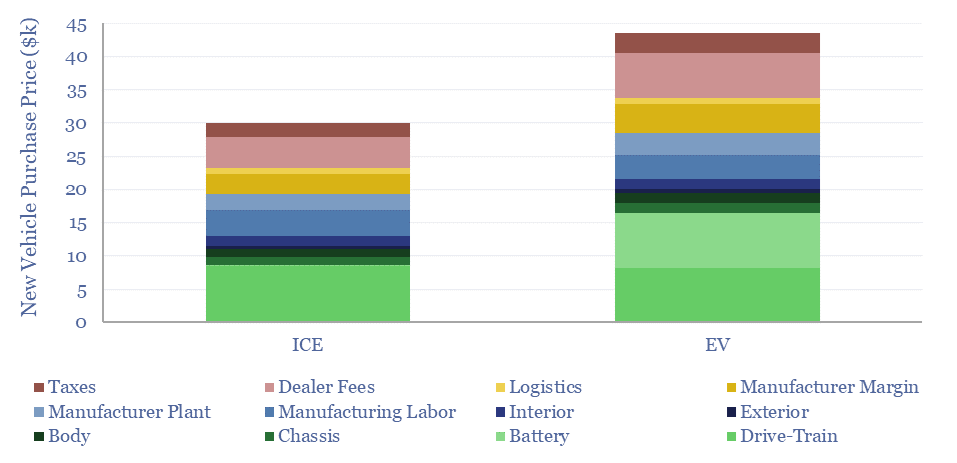
This data-file disaggregates the $30k total cost of a typical new ICE and the c$45k total cost of a typical new EV, as a sum-of-the-parts, across 25 cost lines. Drivetrain costs are similar at $8-9k each. The key challenge for the EV is the battery. The electric vehicle cost breakdown shows promise for improving power…
-
Electric vehicles: saturation point?
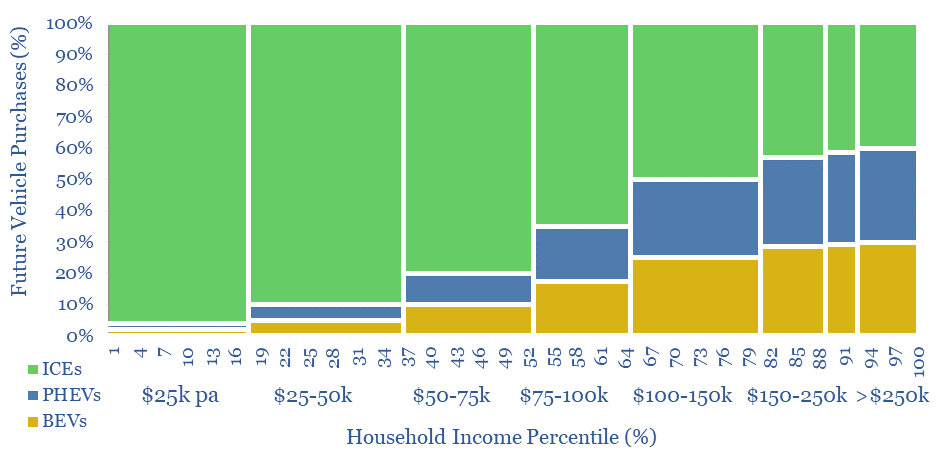
Energy transition technologies are often envisaged to follow S-curves: rapidly inflecting, then reaching 100% market adoption. However, this 17-page report argues electric vehicles will more likely saturate at 15-30% of sales in 2025-30. EVs were already at 15% of sales in 2023. So what would the more limited EV upside mean for energy and materials?
-
Turbochargers: leading companies?
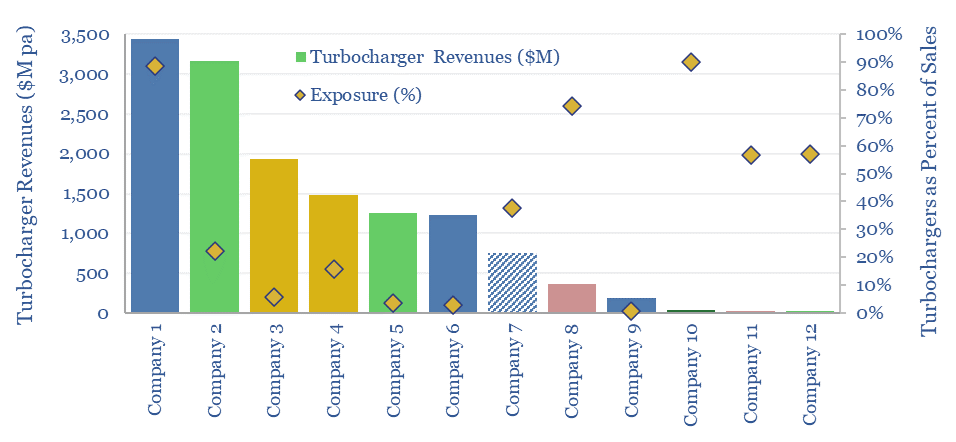
Six leading companies in turbochargers control two-thirds of the $15-20bn pa global turbochargers market. 55% of ICE vehicles now have turbochargers, which can improve fuel economy my as much as 10%, by enabling smaller and better utilized engines to achieve higher peak power ratings. What opportunities ahead, to adapt for vehicle electrification, or even if…
Content by Category
- Batteries (96)
- Biofuels (44)
- Carbon Intensity (48)
- CCS (64)
- CO2 Removals (9)
- Coal (41)
- Commentary (65)
- Company Diligence (104)
- Data Models (922)
- Decarbonization (162)
- Demand (129)
- Digital (86)
- Downstream (47)
- Economic Model (221)
- Energy Efficiency (76)
- Hydrogen (63)
- Industry Data (308)
- LNG (56)
- Materials (86)
- Metals (88)
- Midstream (45)
- Natural Gas (161)
- Nature (76)
- Nuclear (28)
- Oil (176)
- Patents (39)
- Plastics (44)
- Power Grids (155)
- Renewables (153)
- Screen (137)
- Semiconductors (35)
- Shale (58)
- Solar (72)
- Supply-Demand (53)
- Vehicles (95)
- Video (24)
- Wind (47)
- Written Research (406)