Wind
-
Vestas: where’s the IP?
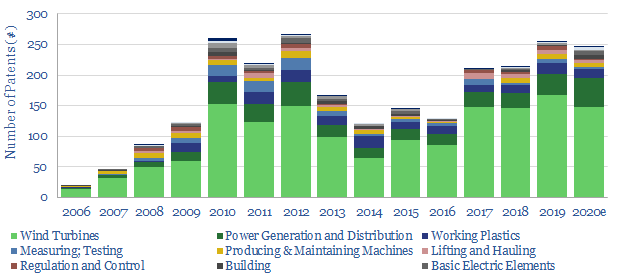
This data-file aggregates 2,000 patents filed by Vestas and compares them with 15,000 patents filed by competitors. Although other companies have made headlines with larger turbines, we find Vestas may have an edge overall, particularly in the category of operations, monitoring, maintenance and ensuring turbines’ longevity.
-
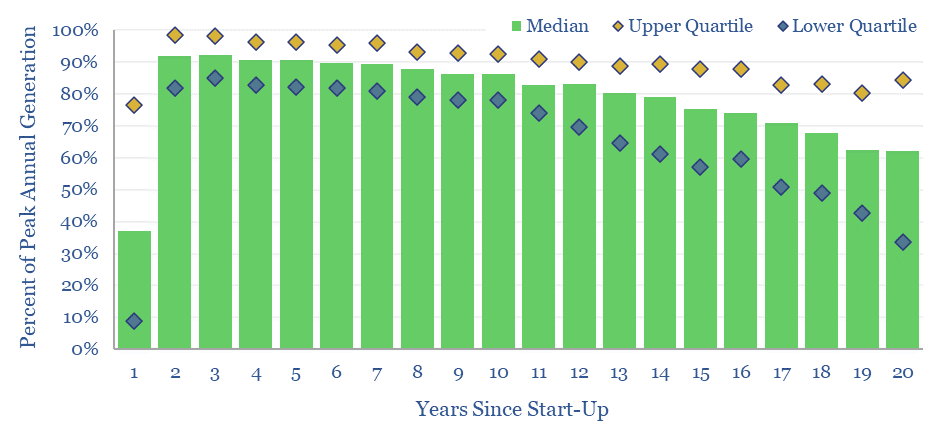
Wind power: decline rate conclusions?
US wind generation profiles are not dissimilar from well-managed oil and gas fields; some projects may suffer 2% lower IRRs versus forecasts if they have not factored in declines; and declines will also become more material over time, slowing the ascent of wind’s share in the power mix (chart below).
-
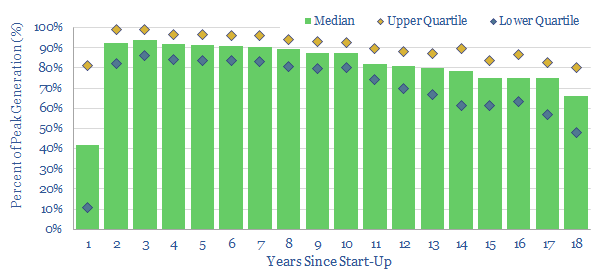
Wind power: decline rates?
This data-file aggregates wind generation by facility, across the US, at 1,400 wind farms, going back 20-years. Wind power decline rates average 1% per year, then possibly accelerate to 3-4% per year in years 10-20. However wind generation is also noisy, typically varying +/- 7% YoY. This matters for the economics and ultimate share of…
-
Land intensity of energy transition: acres per MW and per ton?
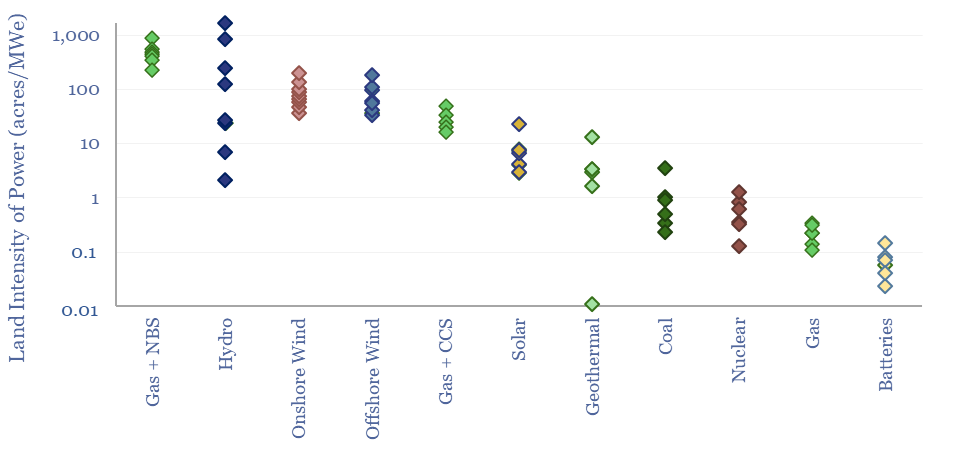
This data-file compares the land intensity of energy technologies and energy transition technologies. Land use is estimated in acres per MW of power generation, or in tons of CO2-equivalents abated per acre per year. Numbers vary by an order of magnitude. Data are sourced from technical papers and our broader work.
-
Energy Transition Technologies?
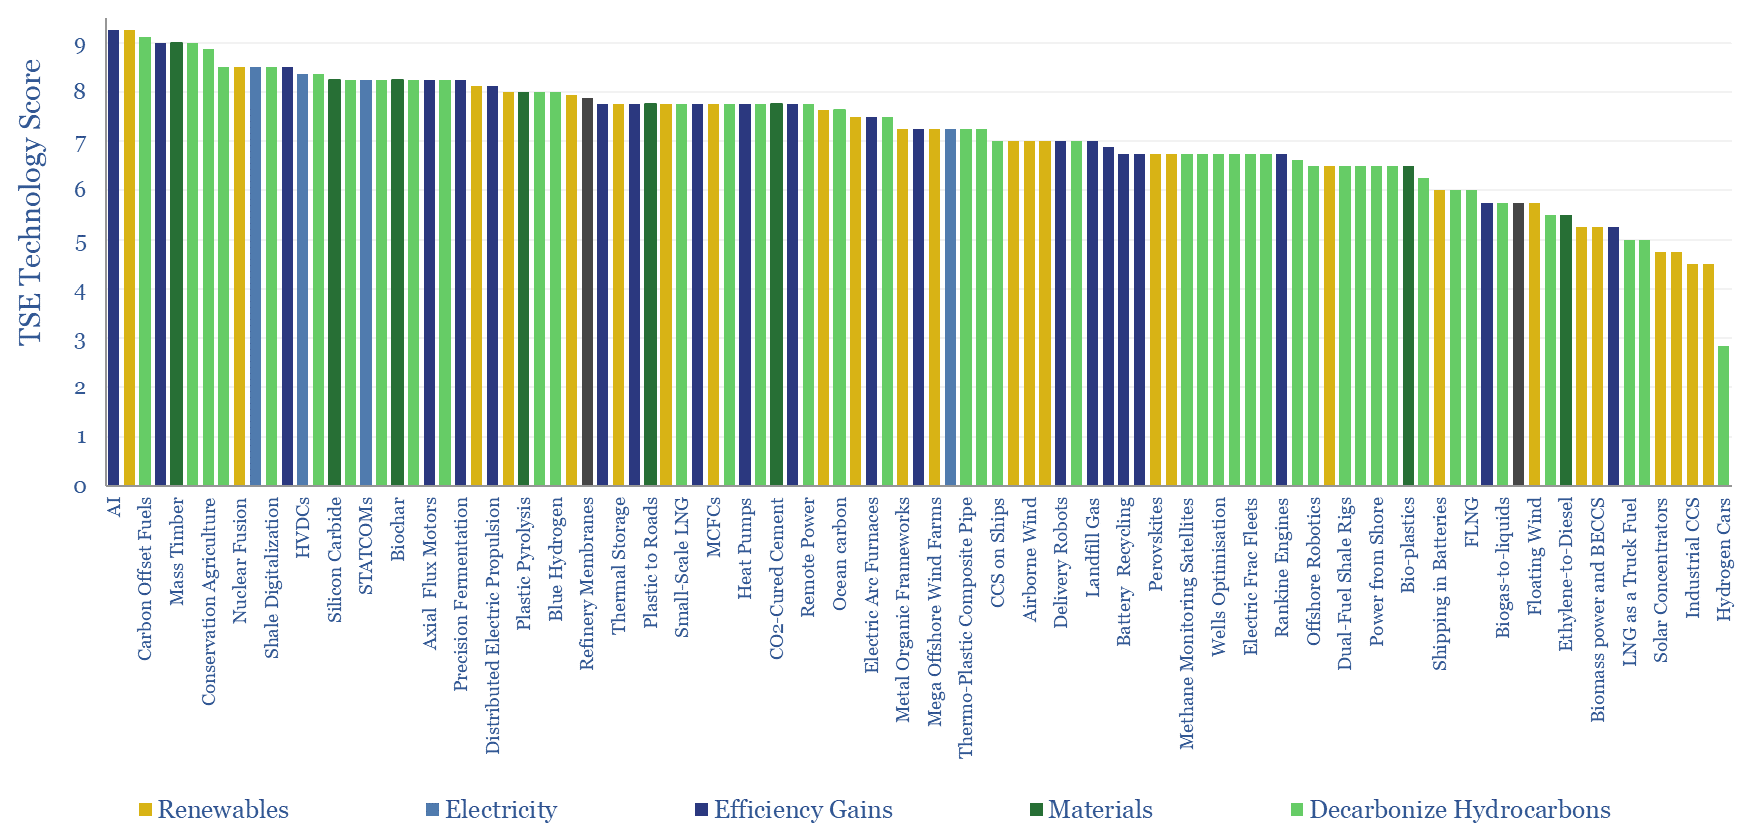
This data-file “scores” the top technologies to transform the global energy industry and the world, as assessed by Thunder Said Energy. Each one is scored based on technical readiness, economic impact and the level of work we have conducted.
-
Offshore wind costs are inflating?
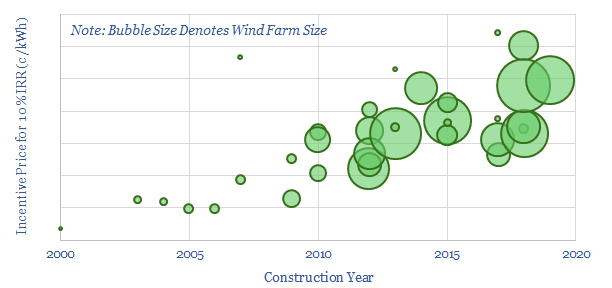
This data-file tabulates the capex costs of 35 offshore wind projects in the UK, with 8.5GW of capacity, which have been installed since the year 2000. There is little evidence for deflation. Rather, breakeven power prices appear to have risen at a 2.5% CAGR over the past decade. Our modelling is show in the data-file.
-
Wind: aim higher?
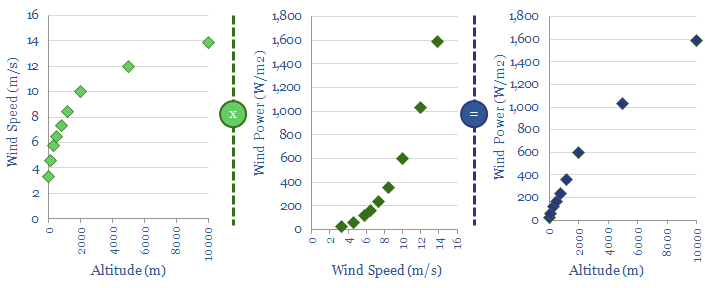
This data-file contains a simple model for how wind speeds and wind power co-vary with altitude. 2x greater power could likely be harnessed by a kite at 300m than a similar-sized turbine at 80m.
Content by Category
- Batteries (95)
- Biofuels (44)
- Carbon Intensity (48)
- CCS (64)
- CO2 Removals (9)
- Coal (41)
- Commentary (65)
- Company Diligence (104)
- Data Models (920)
- Decarbonization (162)
- Demand (129)
- Digital (86)
- Downstream (47)
- Economic Model (220)
- Energy Efficiency (76)
- Hydrogen (63)
- Industry Data (308)
- LNG (56)
- Materials (86)
- Metals (88)
- Midstream (45)
- Natural Gas (161)
- Nature (76)
- Nuclear (28)
- Oil (175)
- Patents (39)
- Plastics (44)
- Power Grids (155)
- Renewables (153)
- Screen (136)
- Semiconductors (35)
- Shale (58)
- Solar (72)
- Supply-Demand (53)
- Vehicles (95)
- Video (24)
- Wind (47)
- Written Research (405)