This data-file compares the land intensity of energy technologies and energy transition technologies. Land use is estimated in acres per MW of power generation, or in tons of CO2-equivalents abated per acre per year. Numbers vary by an order of magnitude. Data are sourced from technical papers and our broader work.
Economic decarbonization is possible in a typical developed world country, but it impacts 20-50% of the available land. Energy transition may also be more expensive in smaller countries. Or outsourced to larger and land-rich emerging nations as part of a just transition.
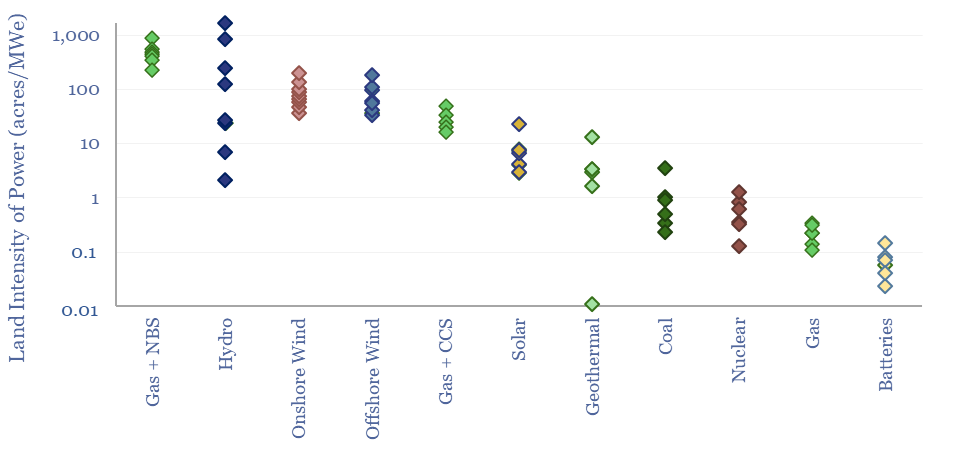
The least land-intensive power generation source is gas turbines, which require 0.2 acres per MW, followed by nuclear and coal plants at 0.5-1.0 acres per MW. Other options are more land-intensive, but is the land intensity of energy transition really an issue?
At 7 acres/MW, a 100 x 100 mile solar plant would occupy about 8% of New Mexico, but could house 1TW of solar modules, about the same as total installed US grid capacity to-date, and enough to supply the average US grid load 2x over (at least when the sun is shining).
At 70 acres/MW, wind is 10x more land-intensive than solar. Wind turbines must be spaced far enough apart to avoid wind-shadowing. On the other hand, placing 1 wind turbine per square mile does not ‘use up’ land. It can still be farmed (our database of global land use is below).
At 500 acres/MW, enough new forest could be planted to completely offset the CO2 from gas-fired power generation, at an average CO2 uptake rate of 5 tons of CO2 per acre per year. This number might sound very high, but it is not dissimilar from many past hydro projects. Indeed, hydro projects have the most variable land intensity of energy categories that are considered in our data file.
Likewise, some ‘renewables only’ grid proposals must build 5-10 MW of renewables per MW of load, in order to store up excess generation in batteries or as hydrogen, and re-release that energy when the wind is not blowing or the sun is not shining (note below).
As a useful comparison point, past data-centers have tended to occupy about 0.5 acres per MW of capacity (scatter plot available in our data-center model).
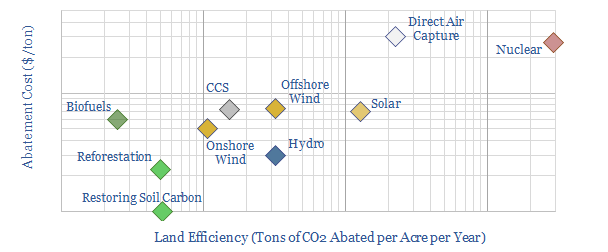
Costs are 65% correlated with land efficiency, in turn, because both metrics tend to correlate with capital intensity. Both metrics are compared in the chart below (note the axes are logarithmic).
Covered technologies in the data-file include gas, coal, nuclear, solar, onshore wind, offshore wind, hydro power, biomass, biofuels, geothermal, batteries, reforestation, restoring soil carbon, carbon capture and storage and direct air capture.