This data-file is our China Energy Model and China CO2 Model, disaggregating China’s energy demand by industry, across coal, oil, gas, wind, solar, hydro and nuclear, across c200 lines, from 2000-2060, with 20-input variables that can be stress-tested. There are routes to reach Net Zero in China by 2060, but it requires some heroic assumptions.
The goal of our China energy model is to track China’s historical energy demand and CO2 emissions, and stress-test different scenarios for China’s future energy demand and CO2 emissions. How do the different variables need to look, for China’s future energy use and CO2 emissions to be consistent with our broader global energy models and global roadmap to net zero?
China matters as it contains 17.5% of the world’s population at 1.4bn people, 17% of the world’s GDP at $18.5 trn, 32% of the world’s manufacturing GDP at $5trn, 27% of the world’s useful energy consumption at 22,000 TWH pa, and 32% of the world’s energy-related CO2 emissions at 11 GTpa. There is no route to global decarbonization without China decarbonization. So what do we need to model?
Demographic changes. The latest forecasts from the World Bank are that after rising at a 20-year CAGR of 0.5% pa, China’s total population peaked in 2022 at 1.4bn people and will gently decline back to 1.2bn by 2050. GDP growth slows from 8% pa in the past 20-years to 4% pa through 2050, which places China’s 2050 GDP per capita on the same level as Europe and Japan today, but 50% below the US. Useful non-industrial energy per capita is only able to rise by about 50% from 6MWH pp pa today to 10MWH pp pa by 2050, versus 20 MWH pp pa in the developed world today. And no rebound effects are included.
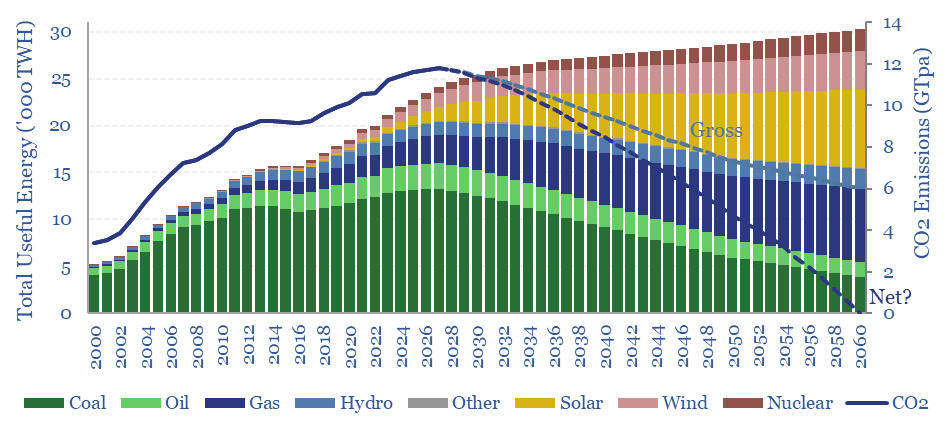
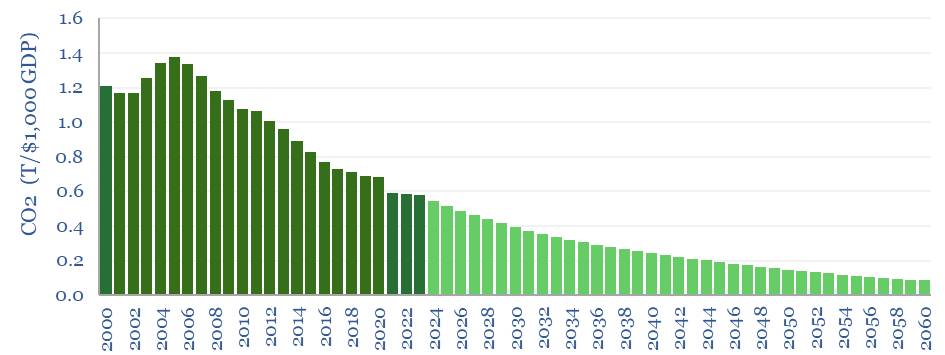
This sees China’s total energy demand levelling off at 30,000 TWH per year, 1.5x higher than today’s levels and the gross CO2 intensity of GDP sustaining its recent 5% pa decline.
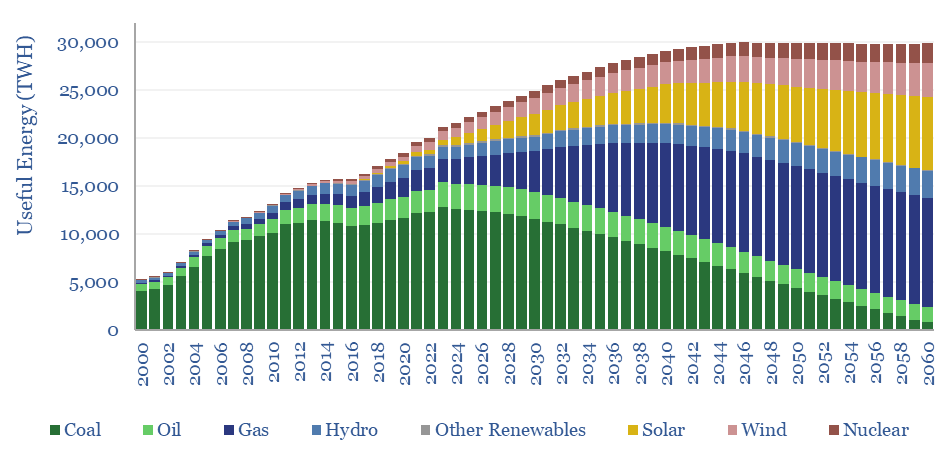
Electrification, solar and wind would also need to step up enormously. Electricity must ramp from 45% of China’s useful energy to 60% by 2050. Solar must ramp 10x by 2050, 13x by 2060, adding 200GW pa of net capacity, increasing solar from 6% of China’s electricity mix today to 40% by 2060. Wind must ramp 2.7x by 2040, 3.5x by 2050 and 4.3x by 2060, adding 40 GW pa of net capacity, doubling wind from 9% of China’s electricity mix to 20%. The total grid reaches 11TW. These are staggering numbers. For comparison, the total US grid rises by 2.6x from 1.3TW today to 3.4TW in 2050 in our US decarbonization model.
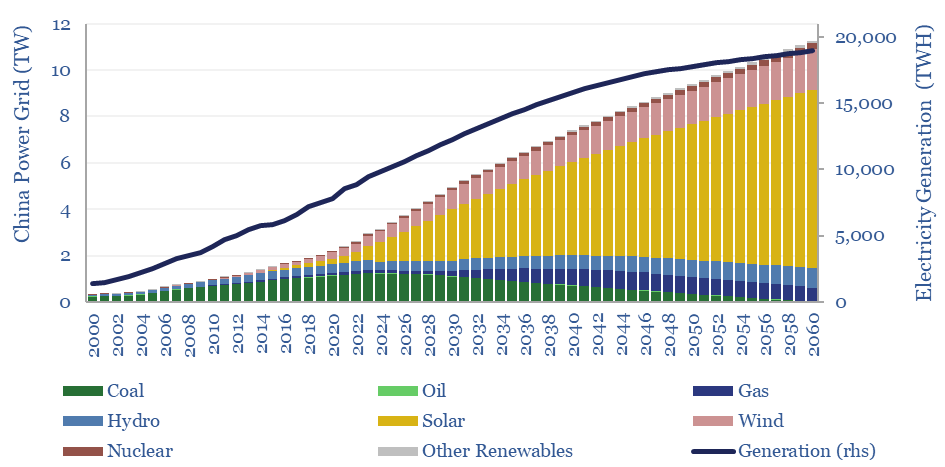
Nuclear generation increases from 435TWH in 2023, rising 3.7x by 2050 and 4.75x by 2060, via building another 200 GW of nuclear capacity. This is equivalent to adding 70M lbs of uranium demand by 2050, or 50% upside on today’s global uranium market.
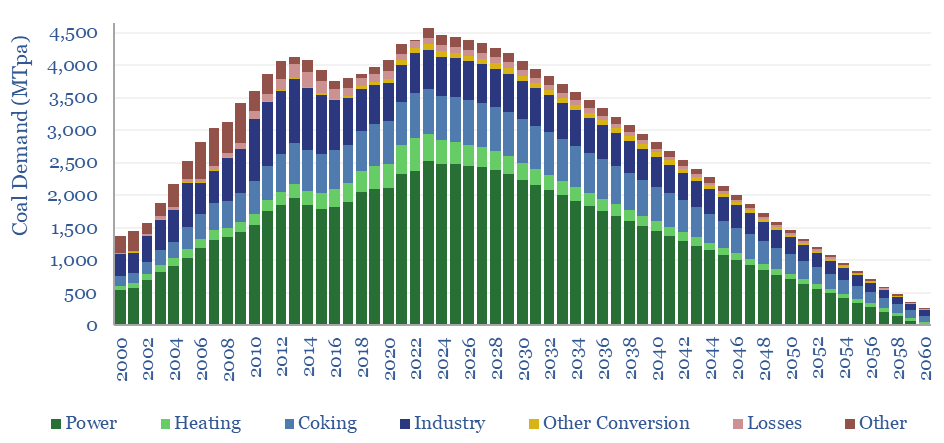
China’s coal consumption currently runs above 4GTpa, providing 60% of China’s useful energy, 15% of the world’s energy, and equivalent to 4 Saudi Arabia’s worth of oil. Coal is the highest carbon combustion fuel, 2x more CO2 intensive than natural gas. Hence decarbonization aspirations require coal to be phased out. Although in the latest version of our model, re-published in January-2025, we are assuming otherwise.
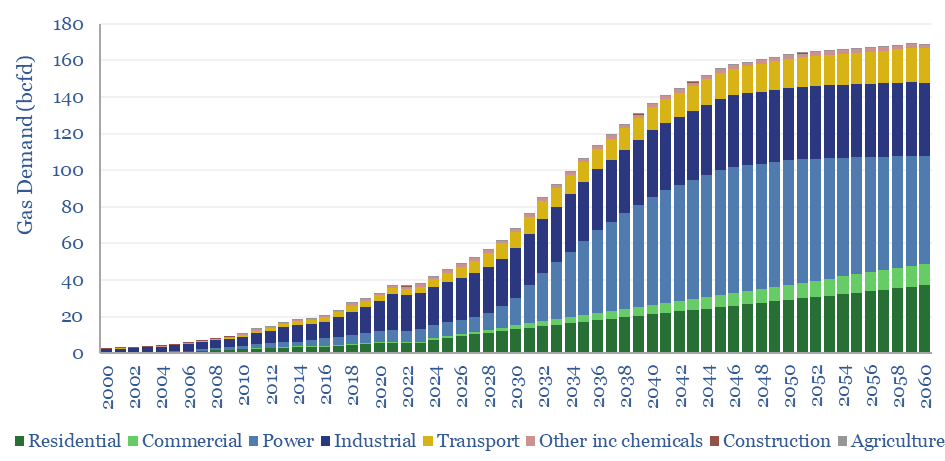
China’s gas demand must therefore rise by 4x, from 38bcfd in 2023 to 160 bcfd in 2050 to in our net zero scenario. This increase is equivalent to 900 MTpa of LNG, 2x today’s total global LNG market, although a portion will be piped gas, not LNG. 32% of the increase is in power to backstop renewables, 13% for industrial heat that is lower-carbon (than coal), 30% is for residential heat, 12% is for commercial heat and 12% is for LNG trucks in transport. Again, we are assuming more coal and less gas in our Jan-25 model update.
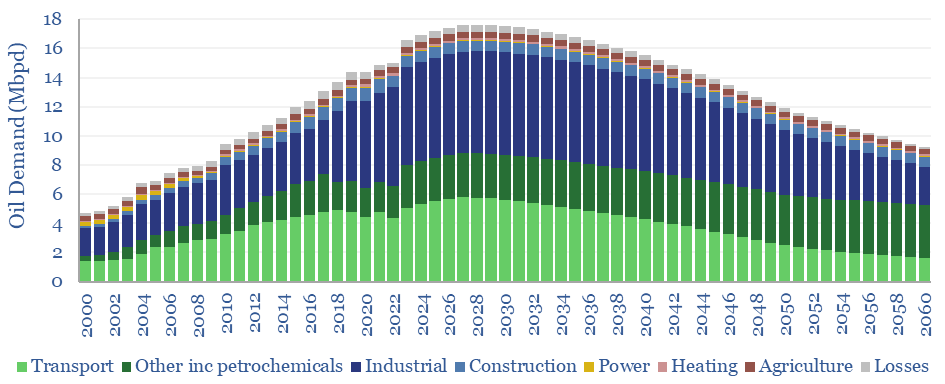
China’s oil demand rises from 16.6Mbpd in 2023 to a plateau of 17.5Mbpd in 2027-30, then falls below 12Mbpd by 2050, and ultimately 80% of all transport miles are electric by 2060, while 25% of the remaining combustion-miles switch to LNG/gas. The largest remaining line items are in industry and petrochemicals, while transportation-related oil demand becomes dominated by jet fuel, long-distance trucks and shipping.
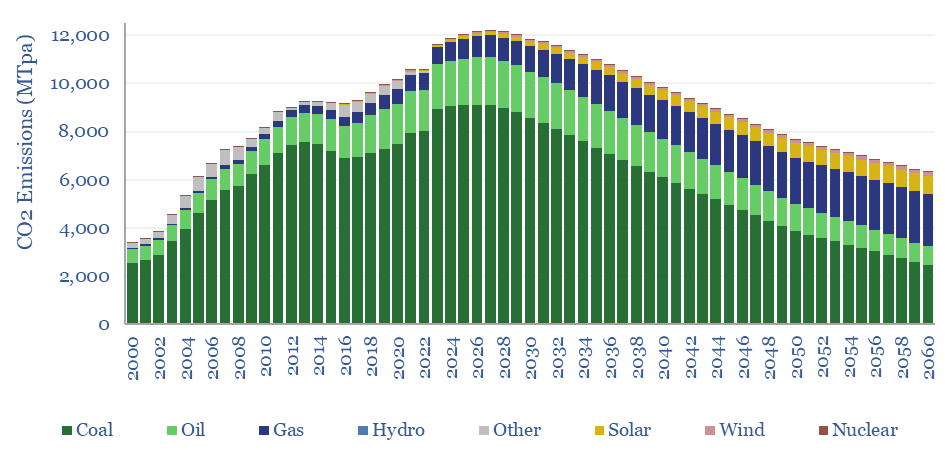
Overall, China’s gross CO2 emissions (energy-related only) are seen plateauing at 11GTpa through 2030, then falling back to 7 GTpa in 2050 and 6 GTpa by 2060. Full decarbonization would thus require a mixture of CCS, nature-based removals and waiting until 2060.
The purpose of this model is to allow decision-makers to stress test input assumptions, and their impacts on China’s energy use and China’s CO2 emissions, Key input variables include population growth, GDP growth, residential energy use, various metrics for efficiency gains and the final share of different generation sources in the power mix.