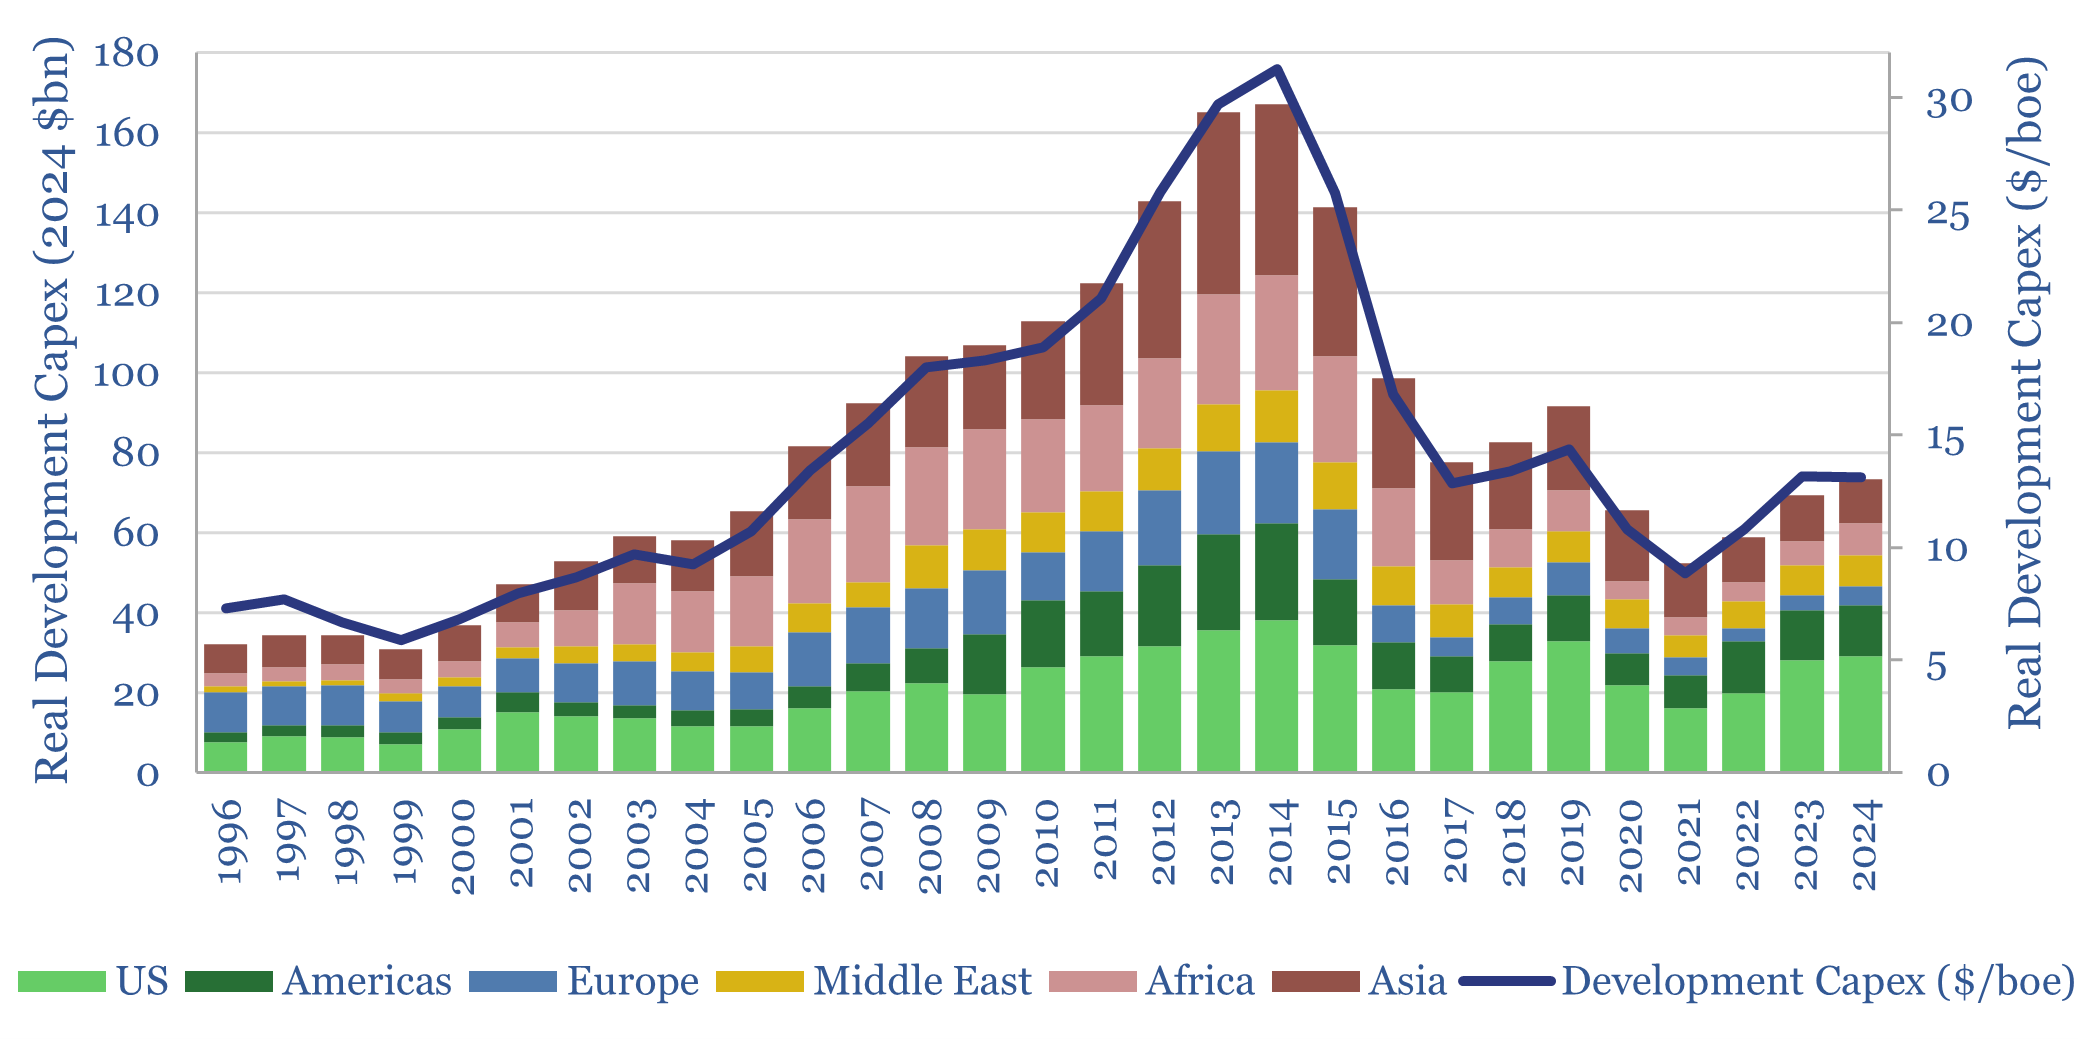
This data-file tabulates the five ‘Big Oil’ Super-Majors’ development capex from the mid-1990s, in headline terms (billions of dollars) and in per-barrel terms ($/boe of production). Real development capex quadrupled from $6/boe in 1995-2000 to $24/boe in 2010-15, collapsed to $10/boe, then recovered to $13/boe.
The peer group of Super-Majors comprises ExxonMobil, Chevron, BP, Shell and TOTAL, which comprise c10% of the world’s oil production and 12% of the world’s gas production. As a good rule of thumb, this group can be thought of as c10% of global production.
Development capex by region: gaining share? The US has always been the most favored destination, attracting c25% of all development capex, both offshore (e.g., Gulf of Mexico) and increasingly for short-cycle shale. However, the share of these companies’ development capex in the US has averaged around 40% in the past three years.
Development capex by region: losing share? Development projects in Africa and Europe have fallen most out of favor. Development capex in Africa peaked at $17bn in 2009, almost 25% of the group’s total development capex, and has since fallen back to $5bn per year, or 8% of the group’s total in 2021-23.
Historically the industry needed to spend an average of $15/boe (real terms) on development capex in order to hold its organic production “flattish” (including some large acquisitions in 2014-17, such as Shell buying BG). Although this number has fallen due to shale.
Another scary data-point is that this peer group of Super-Majors spent $18/boe (real) on development projects in the decade from 2004-14 (which is 80% more than recent levels of spending) yet its net production declined by 1.5% per year over this timeframe.
Similar data for Super-Majors’ exploration capex over time is tabulated here.
Upstream oil and gas capex rose by 7% YoY, to reach $570bn in 2024, led by Middle East and Asian NOCs, whose spending is up +50% since 2017. But the Big Five Oil Majors have only increased their nominal upstream organic capex by 10% since 2017, reaching $80bn in 2024, or $14.5/boe. One controversy is whether Western climate policies are surrendering relevance and competitiveness without necessarily slowing the rise of global CO2 emissions. Another controversy is whether European energy producers will re-focus on competitiveness.
This data-file aggregates the Oil Majors’ development capex, across ExxonMobil, Chevron, BP, Shell and TOTAL disclosures, apples-to-apples, back to 1995, based on supplementary oil and gas disclosures, in the SEC’s EDGAR archives.
