Electric vehicles’ total cost of ownership remains 40% higher than ICE vehicles’, at $7,000 per year, versus $5,000 per year, all based on the latest 2024 data, for 50 vehicles. Electric vehicle up-front prices are 55% higher, insurance costs are 30% higher, while energy costs are 60% lower. 20 different pricing metrics are compared and contrasted in this data-file.
Total costs of ownership for electric vehicles and ICEs are built up in this data-file by evaluating 50 sedans, SUVs, pick-up trucks, hybrids, plug-in hybrids and battery electric vehicles, and compiling key metrics.
All of the data are gathered apples-to-apples in the US, for comparability. For example, we have taken starting prices for vehicles (i.e., without add-ons), obtained quotes for total cover insurance for each vehicle, and are using the same mileage, gasoline prices and electricity prices across the board. These variables can be flexed in the data-file.
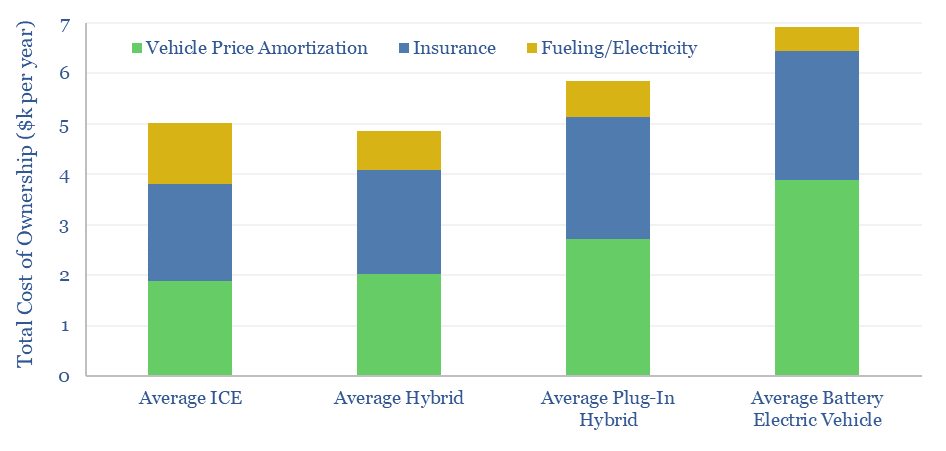
Total costs of ownership across all categories run to $6,000 per vehicle per year, of which 45-50% is amortization of the up-front cost of the vehicle, 35-40% is insurance and 15% is fuel/electricity.
The total cost of ownership for electric vehicles screens as being 40% higher than for an ICE, based on the examples tabulated in this data-file, at $7,000 per year and $5,000 per year, respectively.
Electric vehicles’ total cost of ownership is higher due to 55% higher up-front vehicle cost (mainly due to the batteries), 25% shorter vehicle lifetimes, 33% higher insurance costs (due to the risks of battery fires) but -60% lower annual fueling costs.
Are the data comparable? The average ICE and EV in our data-file both had the same internal passenger volume (in m3). The ICEs have the advantage of 2x longer ranges (in km or miles). The EVs have the advantage of 50% higher horsepower, and 4x higher fuel economy (in mpg or kWh/km).
We have compiled 20 key charts in the data-file (examples below), contrasting the different vehicles, comparing different cost metrics versus different performance metrics.
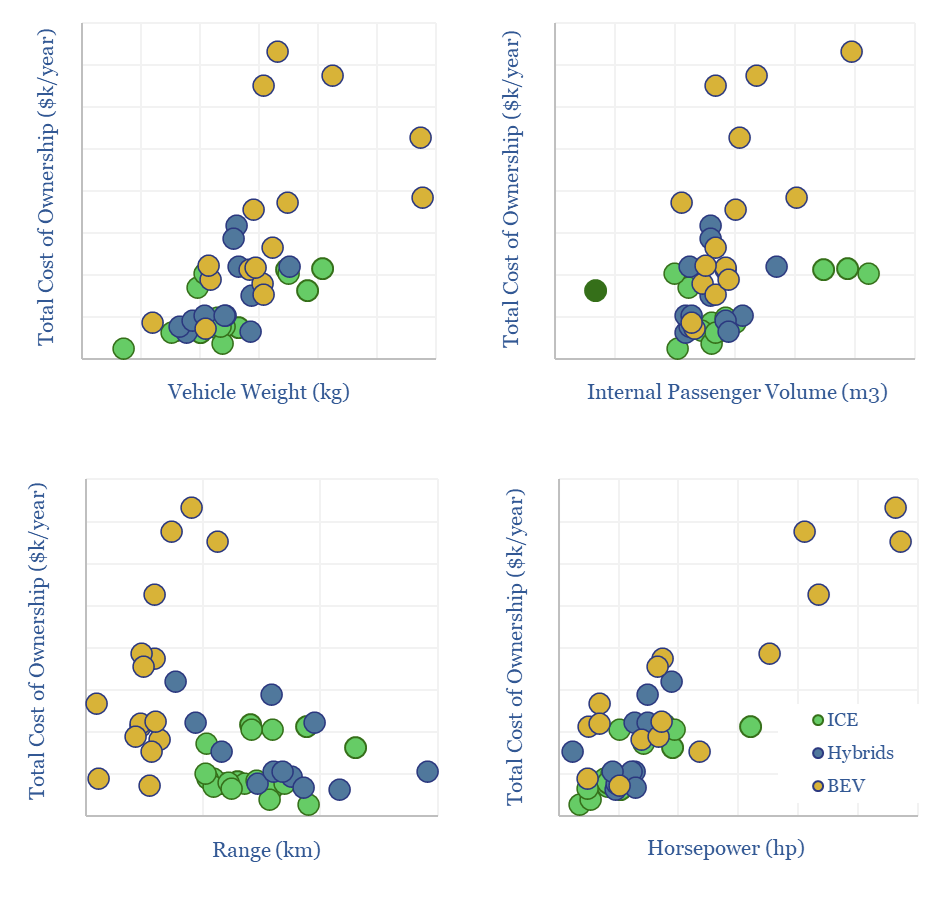
Electric vehicles are already cost competitive when comparing total cost of ownership per unit of horsepower. However, they are 2.5x more expensive per km of range, and 40% more expensive per m3 of internal passenger volume.
Hence we still think there is more risk to the downside versus the upside in our electric vehicle sales forecasts, and by extension, there may be upside in our long-term oil demand forecasts. For more, please see our broader research into vehicles in the energy transition.