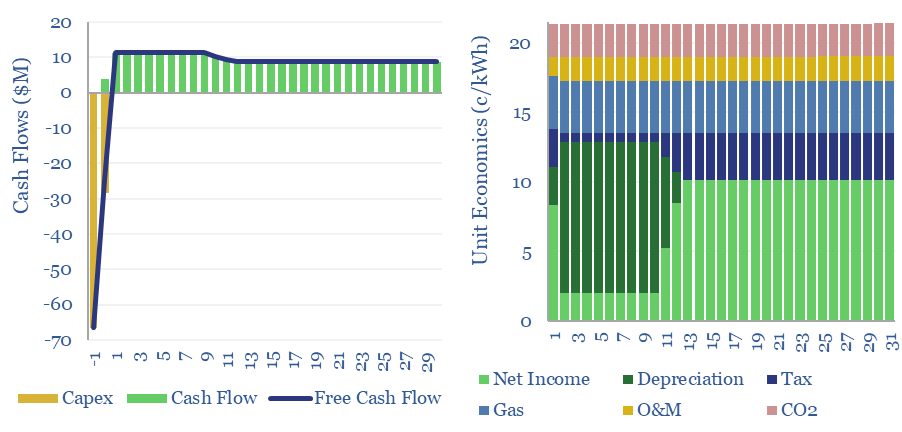
Gas peaker plants run at low utilizations of 2-20%, during times of peak demand in power grids. A typical peaker costing $950/kW and running at 10% utilization has a levelized cost of electricity around 20c/kWh, to generate a 10% IRR with 0.5 kg/kWh of CO2 intensity. This data-file shows the economic sensitivities to volatility and utilization.
The economics of gas peaker plants are all about volatility. Hourly power prices are lognormally distributed, which means their natural logarithms are normally distributed, per other commodity prices, and upside volatility is higher than downside volatilty (chart below).
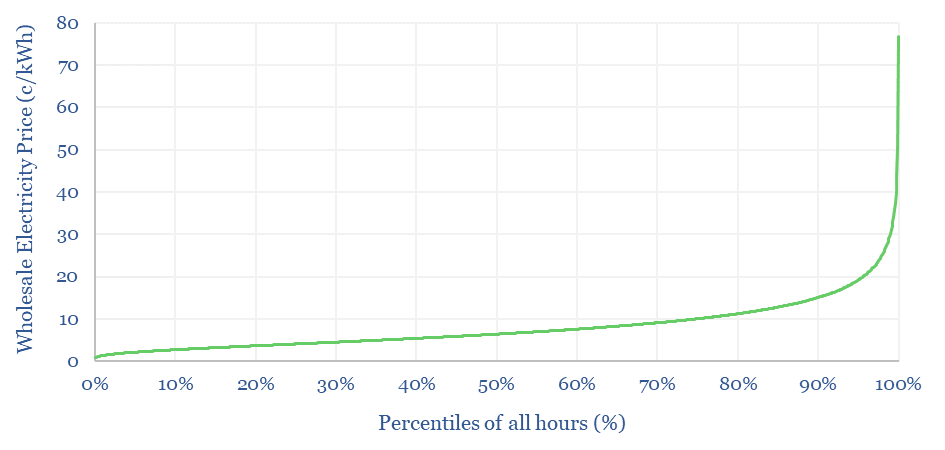
Hence a grid with 10c/kWh mean average power prices can easily host a peaker that achieves 20c/kWh average power prices 10% of the time, even assuming non-perfect alignment between generation profiles and peak pricing. This can be flexed in the model, and is informed by actual data in ERCOT, CAISO, the UK, and Australia.
Another source of income for gas peaker plants is from capacity payments, which will usually make up 0-20% of total revenues. Grid balancing authorities are required by NERC and FERC to maintain healthy reserve margins that ensure they have adequate capacity to limit major outages to just once per decade.
While we have a separate model of combined-cycle gas turbine economics, capturing plants with >50% utilization, this data-file focuses in upon the economics of gas peaker plants, by modelling out the impacts of capacity payments and upside pricing volatility.
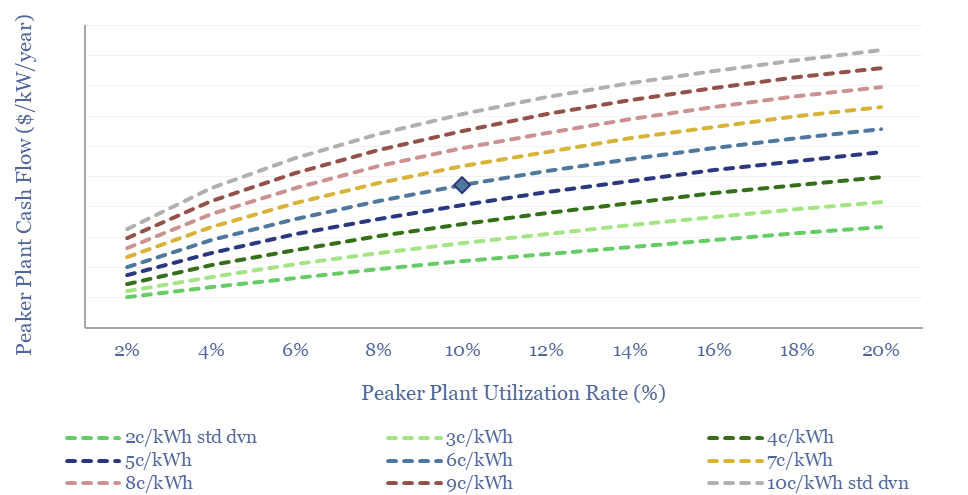
A fascinating observation is that each 1 c/kWh increase in power grid volatility increases peaker plant cash flows by $6/kW/year. Each 1pp reduction in utilization rate lowers cash flow by $5/kW/year. Numbers can be stress-tested in the data-file.
Other inputs in the model are informed by our data into gas turbine parameters, gas turbine capex costs, gas prices by region, CO2 prices and tax rates. However, we think the data-file is a neat way to stress-test the levelized costs of gas peaker plants, as they are impacted primarily by utilization and electricity price volatility.