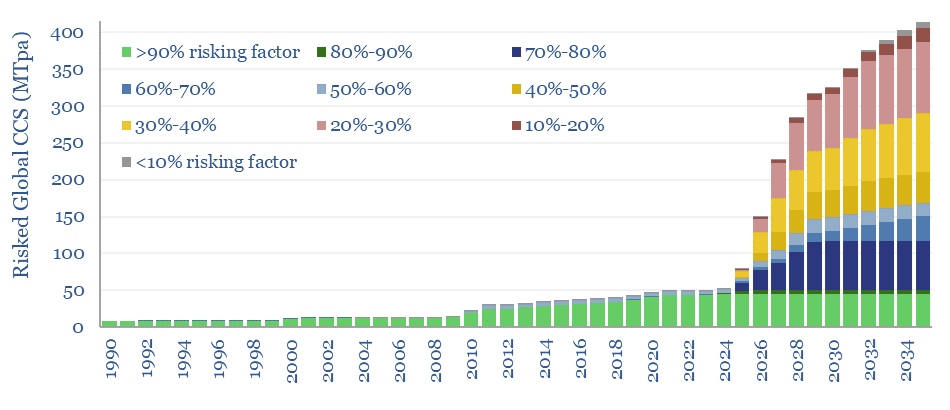
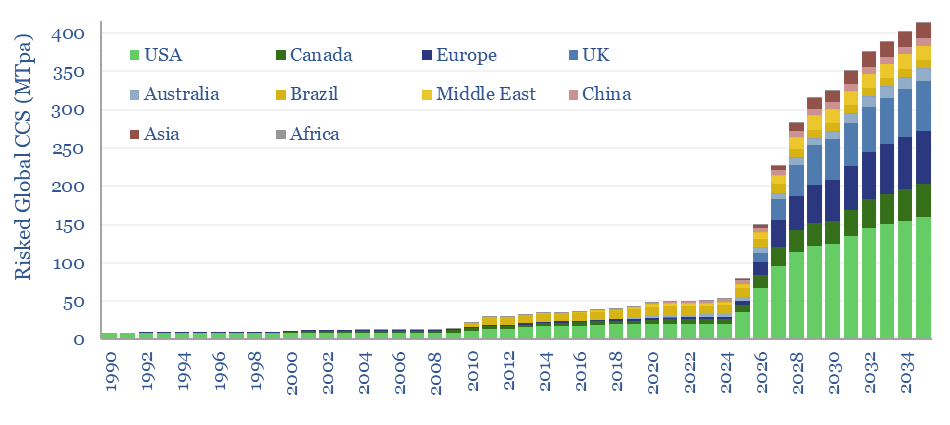
Over 400 CCS projects are tracked in our global CCS projects database. The average project is 2MTpa in size, with capex of $600/Tpa, underpinning over 400MTpa of risked global CCS by 2035, up 10x from 2019 levels. The largest CO2 sources are hubs, gas processing, blue hydrogen, gas power and coal power. The most active countries are the US, UK, Canada and Europe. Project-by-project details are in the database.
An amazing acceleration has taken place in the global CCS industry in the past half-decade. In 2019, there were about 30 historical CCS projects in the world, with a combined capacity of 40MTpa. Today, there are well over 400 projects in various stages of planning and construction. This is verging on being too many to count. The CCS Institute does a fantastic job of following many of the projects. We are also trying to gather details on these projects and count up their capacity.
We have attempted not to over-count the CCS projects, however. About 200 of the projects are in an early stage of planning/development and therefore need to be risked. We are using an average risking factor of 30% in our models, based on mathematical rules and subjective assessments.

We have also attempted not to double-count them. About c100 of the projects are hubs, which gather someone else’s CO2. Clearly, if I capture 1MTpa from my auto-thermal hydrogen unit, feed it into your 1MTpa CO2 pipeline, and you pass it to a third party’s 1MTpa CO2 disposal facility, then the total quantum of CCS is 1MTpa and not 3MTpa.
Our risked forecasts underpin 325MTpa of global CCS by 2030 and 415MTpa by 2035. This would be a dizzying increase from 40MTpa in 2019. But for perspective, our roadmap to net zero requires 7GTpa of CCS by 2050, and a straight-line journey from 2024 to 2050 would therefore require 3.5GTpa of CCS by 2037. So we would need about 10x more CCS projects to enter the pipeline. New projects are being scoped out over time, and will continue layering in on top of what we have quantified in this data-file.
CCS breakdown by region? 85% of risked CCS capacity in the data-file by 2035 is seen coming from the developed world, led by the US (40%), the UK (17%), Europe (16%), Canada (11%) and Australia (4%). The UK ambitions are perhaps boldest, rising from nil today to a risked potential of 65MTpa by 2035 (the official UK target is 20-30MTpa by 2030).

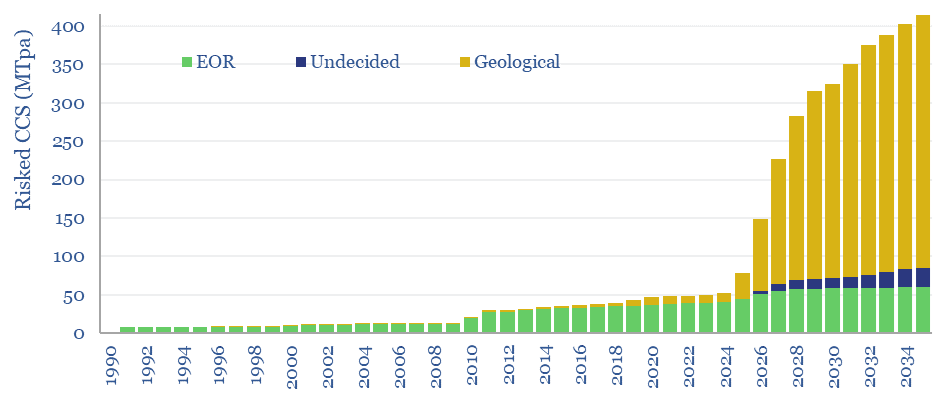
CCS breakdown by disposal method? A shift from CO2-EOR to geological storage is also seen in the database. Today, 80% of all CCS is associated with EOR activity, while by 2035, 80% is seen being for geological storage.

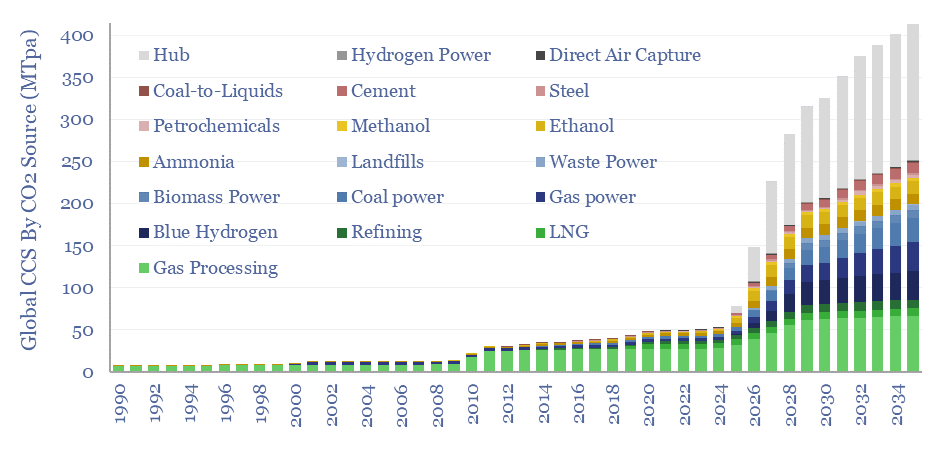
CCS breakdown by CO2 source? The biggest change seen by 2035 is the emergence of CCS hubs, which handle 40% of risked CCS by 2035. To the extent that we are including these hubs in our risked forecasts below, it indicates that the CO2 source has not yet entirely been locked down, but will be gathered from regional emitters.

The biggest clear source of CO2 for CCS, in tonnage terms, is still for gas processing, although its proportionate share declines from 55% today to just c15% by 2035. The second biggest clear source is via the rise of blue hydrogen and blue ammonia projects, which are the source for 11% of risked CCS by 2035. Ethanol projects are most numerous, but also tend to be smaller at 0.2MTpa, and thus only underpin 4% of our risked total by 2035. Note that these are all pre-combustion or non-combustion sources of CO2 and bypass the potential risk of amine degradation and emissions.
Almost 20% of risked CCS is associated with power generation, in a split of gas (8%), coal (7%), biomass (2%) and waste (1%). For more details, see our overview of CCS energy penalties. For further analysis, this is the category where we are most interested to delve deeper, perhaps with a dedicated note looking at leading case studies and whether they are proceeding on time and on budget.
The full database is available for download below, or for TSE full subscription clients, in case you want to interrogate the numbers, or look into the underlying project details and riskings that we have been able to tabulate and clean up.