
Global population and GDP are broken down in this data-file, across 10 key regions, with data back to 1960 and projections to 2050, as an input to all of our supply-demand models. Population rises at 0.6% pa from 8.2bn in 2025 to 9.6bn in 2050. Real global GDP rises at 2.4% from $117trn in 2023 to $210trn by 2050. Mega-trends are underway in demographics, manufacturing and defence.
Population and GDP growth underpin many of our supply-demand models out to 2050, such as our outlook for energy demand, plastics demand, steel demand, EV adoption and other commodities. Hence this data-file contains the key inputs, across the US, Canada, Europe, Japan, Australia, LatAM, China, India, other Asia and Africa.
Global population stood at 8.2bn people in 2025, having doubled since 1975, rising at +1.0% pa in the past ten years, but decelerating to +0.6% pa to 2050, when world population will reach 9.6bn people.
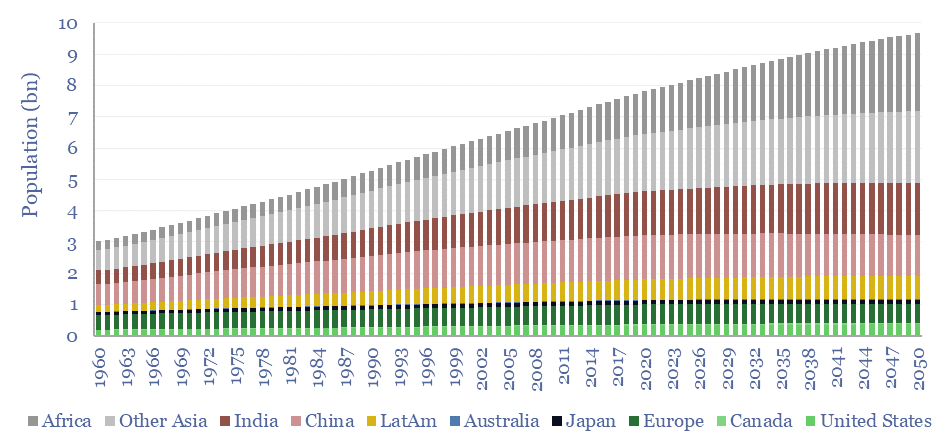
The five wealthy regions — US, Canada, Europe, Australia and Japan — comprise 1.1bn people with an average 2025$ GDP per capita of $60k. They are 15% of the world’s people, 38% of its energy consumption, 56% of its GDP and 60% of its total household consumption. By 2050, they will only comprise 12% of the world’s people, 22% of its energy, and 45% of its GDP and household consumption.
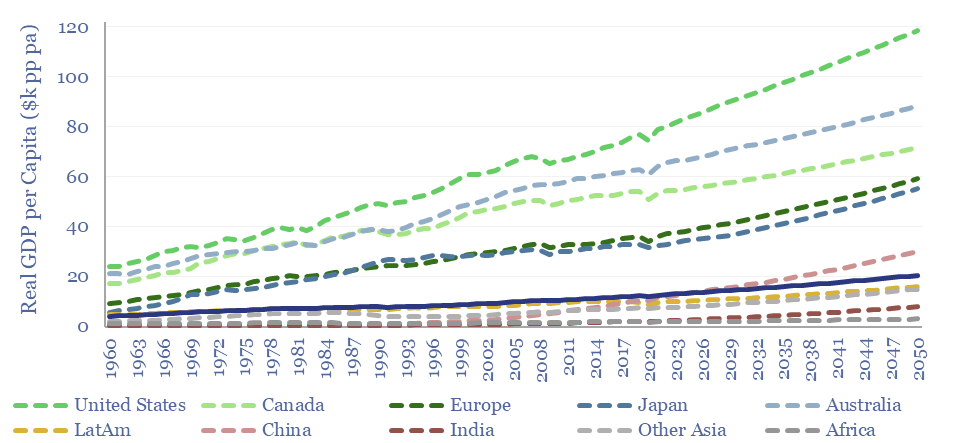
A ‘just transition‘ also clearly cannot suppress income growth for the 4bn people with GDP per capita below $4k pp pa. Today’s global average is $14k pp pa. It rises to $22k pp pa by 2050.
Real global GDP is estimated at $117 trn in 2025, rising at 2.6% pa in the past decade, continuing at 2.6% pa through 2030 and then 2.4% pa from 2030-50. GDP is also decomposed by region and by category, across consumption, households, manufacturing, investment, defence. Long term trends have major implications.
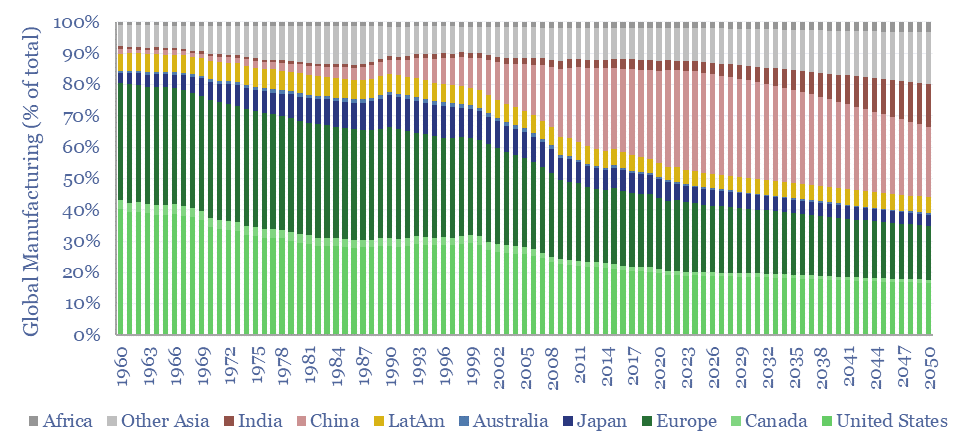
Manufacturing, for example, comprises 15% of global GDP. The US and Europe declined from 75% of global manufacturing value add in 1965 to just 40% in 2023. Whereas China rose from almost nothing to one-third of global manufacturing value add (charts below).
As a methodology, our forecasts for global population and GDP are built-up across 218 countries, based on disclosures from the IMF and World Bank, then aggregated together, per the Countries tab, which shows which countries we categorize into which regions.
For auditability, all underlying input data are preserved in their original formatting. Whereas data-points added or categorized by TSE are in Georgia font and our usual blue text coloring/highlighting.
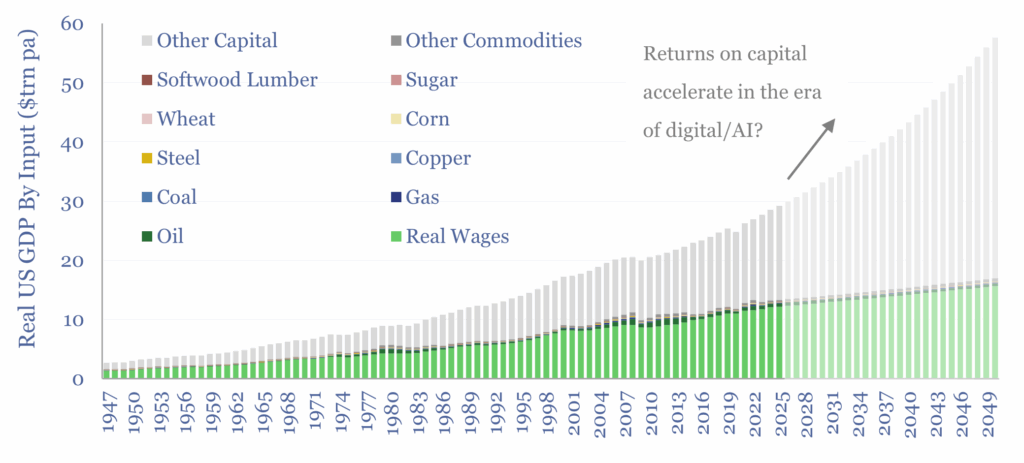
For the US, in particular, we have also attempted a GDP breakdown by factor input, across labor, commodities and returns on capital (chart below).
Underlying population data are sourced from the World Bank. Last downloaded in January-2026. GDP data and GDP growth are sourced from the IMF, last updated November-2025.