This data-file quantifies utilization rates by industry, which tend to average 80-90%, especially in manufacturing and materials contexts. The highest utilization rates are found in oil and gas, refineries, mining, chemicals and metals facilities. This is not always entirely consistent with being fully powered by volatile wind and solar.
Renewables will ramp up to 25% of global energy consumption by 2050, on our models for a fully decarbonized energy system. This is a vast achievement. But many commentators ask why renewables’ share is not higher. One reason is that renewables operate at low utilization rates (around 15-45% of installed capacity) and are volatile, while industrial demand requires higher utilization rates.
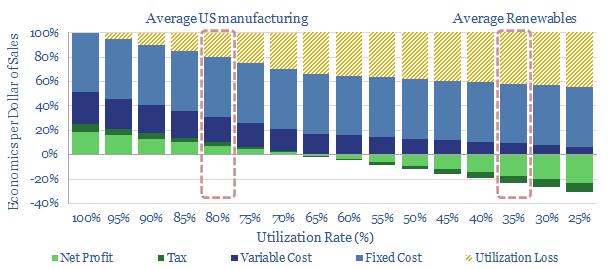
This data-file tabulates the utilization rates of different industries over time, based on a variety of data sources. Average US manufacturing utilization rates ran at almost 80% prior to the COVID crisis, to sustain c10-20% operating margins, with many commoditized industries running above 90%.
On average, US industry has run at 77% capacity utilization since 2005 (74% for durable, 76% for non-durable), although this includes recession times, such as during 2020’s COVID crisis, when aggregate industrial utilization rates fell to as low as 55%. Useful month-by-month data on the utilization of different industries is avaiable from the St Louid FED.
Utilization matters. A 5pp reduction in utilization rates (e.g., due to over-reliance on volatile renewables) could cut manufacturing profits by 35%. At 35% utilization, no manufacturing facility with >20% fixed costs is likely to turn a profit. This matters as manufacturing industries comprised $2.4trn of US GDP in 2019 (11% of the total) and c25% of energy consumption.
Falling utilization rates also underpin a levelized cost paradox for renewables. Our favorite method to backstop the volatility of renewables is via demand shifting, which will help relative margins in industries with flexible power demand (our best note, looking across different industries, is linked here).
To stress test the utilization rates of different industries, and the impact on their economics, we have also constructed 175 economic models, across all of our research to date, available here.