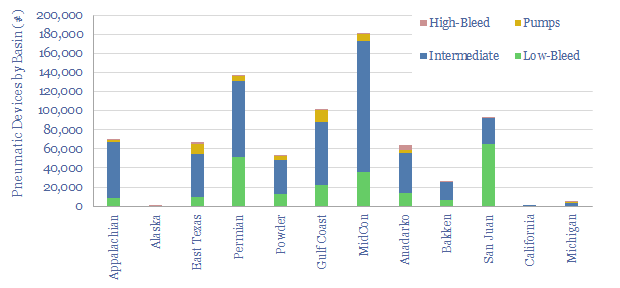
Methane emissions from pneumatic devices across the US onshore oil and gas industry comprise 50% of all US upstream methane leaks and 15% of all upstream CO2. This data-file aggregates data on 800,000 pneumatic devices, from 300 acreage positions, of 200 onshore producers, in 12 US basins.
Pneumatic devices are valves and pumps that are actuated by pressurized natural gas, widely used in the oil and gas industry, and numbering around 800,000 in the US in 2021, across 22Mboed of production that we are tracking, acreage position by acreage position, based on EPA disclosures.

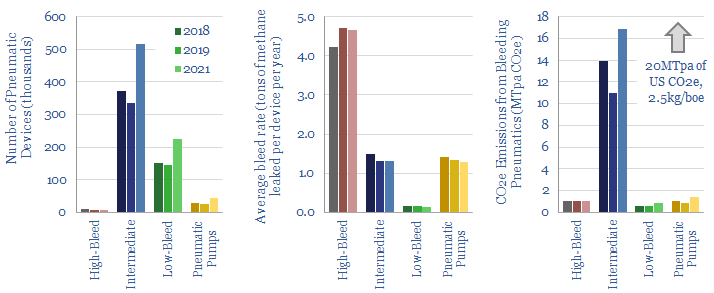
The problem with pneumatic devices is that they leak methane, a greenhouse gas, emitting an average of 1 ton of methane per device per year, explaining 20MTpa of US CO2e emissions, equivalent to 2.5 kg/boe of Scope 1 CO2 emissions, or around half of the CO2 attributed to methane leaks in the US upstream oil and gas industry.

So over time, we expect bleeding pneumatic devices to be phased out in the US, especially ‘high bleed’ pneumatic devices, which emit around 5 tons of methane per device per year, as part of the industry’s growing efforts to mitigate methane. (This note also covers companies in the supply chain to help mitigate methane emissions from pneumatic devices, including a switch to electrically actuated devices, example here).
We have been tracking methane emissions from pneumatic devices in the US oilfield since 2018, although the latest data from 2021 do not show much improvement in aggregate (chart above).
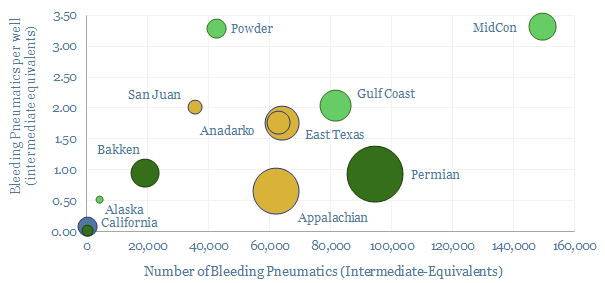
The average well that is in operation in the US oilfield is associated with 1.4 bleeding pneumatic devices, although it is highest in basins that produce similar quantities of both oil and gas, at 2-3 pneumatic devices per well in the MidCon, Anadarko basin and Eagle Ford, while it is lowest in the Marcellus and Utica, at 0.75 pneumatic devices per well, as pure-play gas producers primarily aim to monetize not leak their gas.

Methodology. Note that in the chart above we have adjusted the data into ‘intermediate equivalents’. For example, the average low-bleed pneumatic device emits 9x less methane than the average intermediate-bleed device, and so we consider 9 low-bleed devices “equivalent” to one intermediate bleed device.
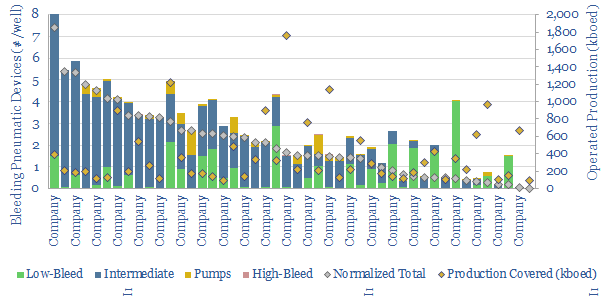
Pneumatic devices per well also vary vastly by operator. The best operators have well below 0.5 pneumatic devices per well, while some have shifted almost entirely to electrically actuated devices that use no methane.

Leaders include Pioneer, EOG, Diamondback, with no high-bleed pneumatic devices, and very few intermediate-bleed pneumatic devices across their portfolios.
On the other side of the spectrum are operators with 2-7 bleeding pneumatic devices per well. We have wondered in the past whether regulations are going to tighten and clamp down upon bleeding pneumatic devices, especially high bleed pneumatic devices, and create large capex burdens on companies with methane-leaking assets.
In one case, it is surprising to us that a well-known E&P company, advertising itself as one of the ‘greenest’ operators in the US still has over 1,000 high-bleed pneumatic devices across its asset base, or over 10% of all the high-bleed pneumatic devices in the US.
Underlying data into the CO2 intensity of US oil and gas producers is aggregated by basin, by producer and by acreage position here. Another large source of methane leaks is flaring, covered in our note here.