
This data-file tracks the timing and magnitude of peak power demand, across different grids in the North Hemisphere, with case studies. This matters for grid-planning, gas peakers and batteries. In the US, peak demand is typically driven by high AC loads in summer heatwaves. In Europe’s milder climate, only c10% of homes have AC, and peak demand is almost always for heating during winter cold snaps.
Power grids are sized to meet peak demand. In other words, there must be sufficient generation capacity, transmission capacity, distribution capacity and redundancy to supply peak power demand, whatever it happens to be, with no more than a “1 year in 10” loss of load expectation (LOLE). In the past, meeting peak power demand has relied heavily on capacity markets. In the future, there is a desire to rely more on smart grids and batteries.
But peak power demand by region varies by region, as tabulated in this data-file. Regions covered include CAISO, ERCOT, France, Germany, ISONE, Italy, Japan, MISO, the Netherlands, Norway, NYISO, PJM, Spain, SPP, Sweden and the UK grid.
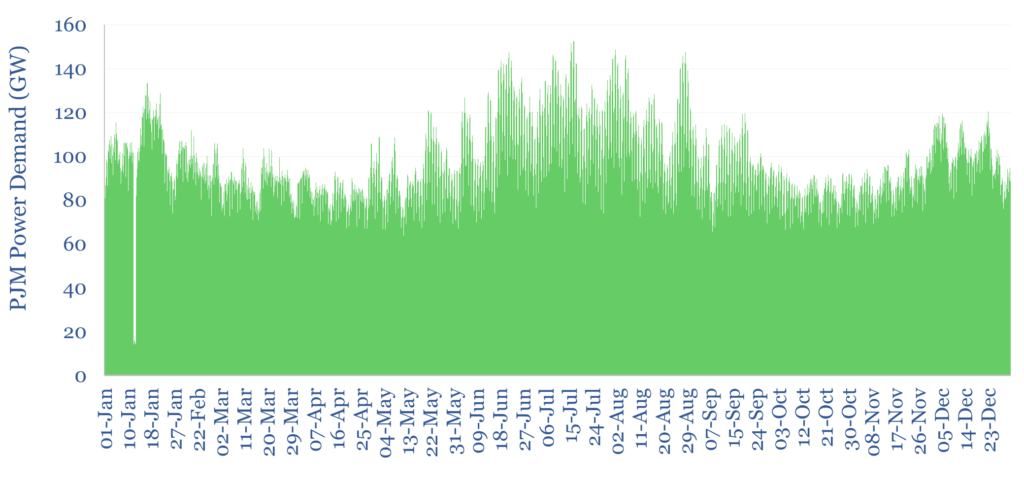
If we take PJM, for example, which is the largest Regional Transmission Operator in the US, and home to a large raft of data-centers, peak demand in 2024 came at 6pm on Tuesday the 16th of July. It is no coincidence that this was the hottest day of the year in 2024, with temperatures in Washington DC peaking at 102.9°F, and remaining at this level until about 5pm, i.e., very late in the evening, as part of a 3-day heat-wave. Peak demand in US grids is almost always determined by AC loads.
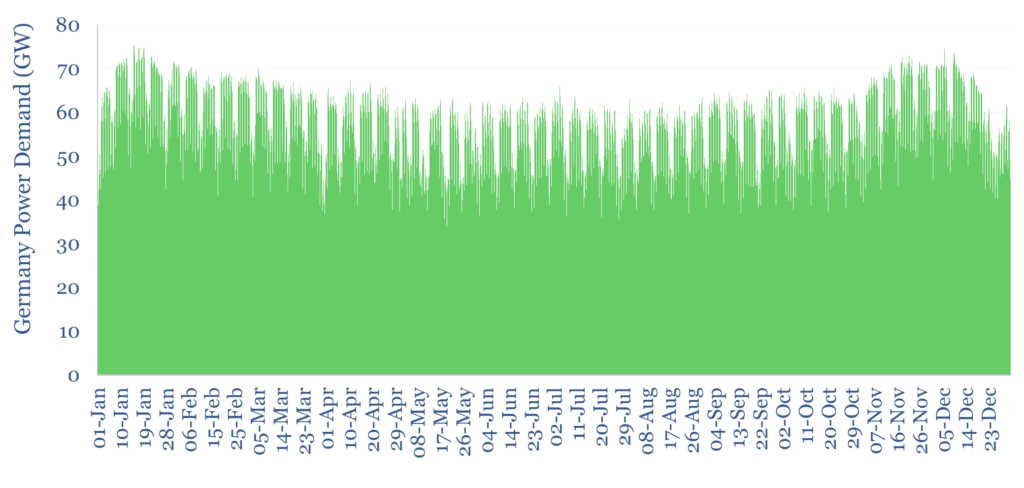
If we take Germany, however, as another example, comprising the largest power grid in Europe, only about 19% of households have AC, and the peak demand in 2024 came during a very cold week of weather in January-2024. This was a week of exceptionally cold weather across Europe. However, power demand also declines during summer and at weekends.
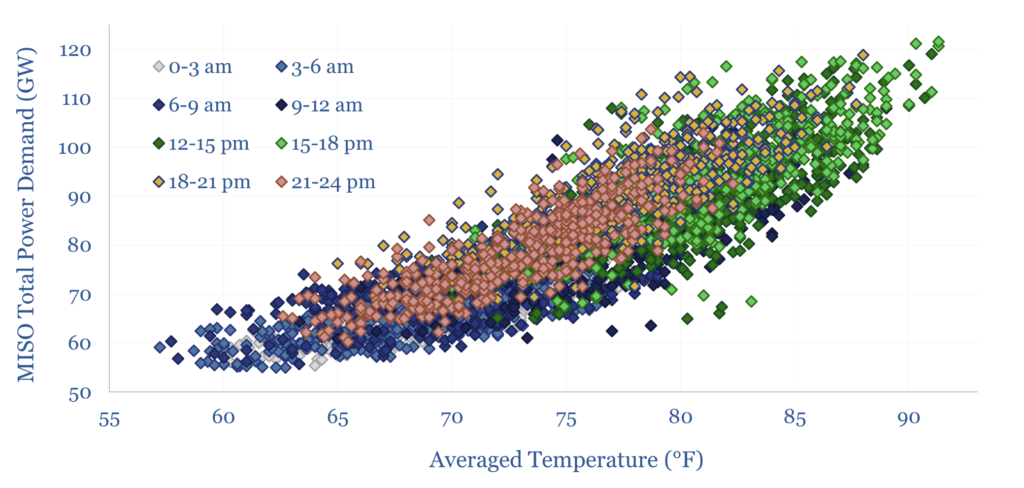
We have also aggregated case studies into peak power demand by region, in order to appraise how peak demand may change in the future. For example, in MISO, summer demand from May-August is 87% correlated with the average temperature across major cities such as Indianapolis, Minneapolis and New Orleans (chart below), and peak demand most often occurs from 3-6pm.
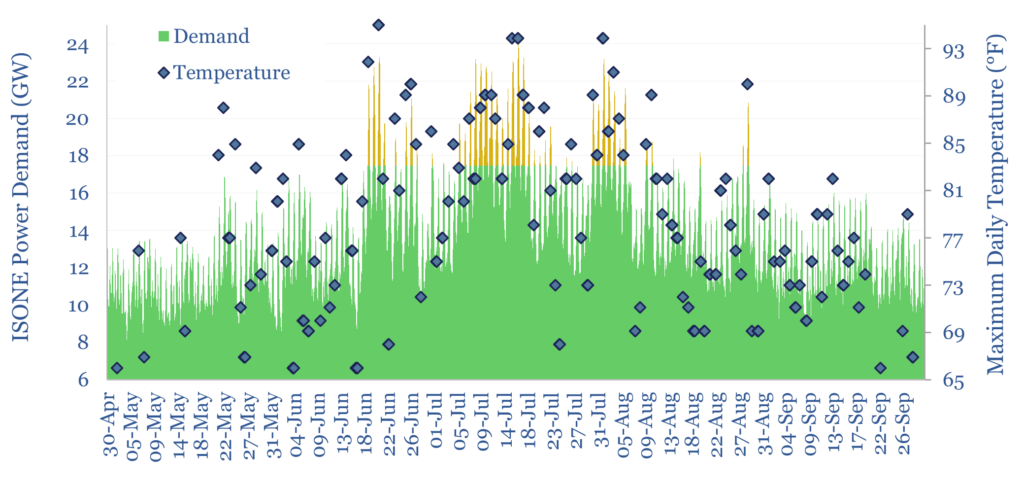
In New England, 30% of the region’s generation capacity is required to meet spikes in power demand during the hottest and most-demanding c5% of hours. These are mainly peaker plants. We ran a case study estimating how big the batteries would need to be in order to shut down a portion of the gas peakers and “ride through” a heat wave (closing just 5% of the peakers would equate to $6k per resident in battery costs!!).
Notes and data on the peak power demand in different regions are aggregated in the data-file. We will add to the data-file over time.