Can large-scale power transmission smooth renewables’ volatility? To answer this question, this horrible 18MB data-file aggregates 20-years of hour-by-hour solar insolation arriving at four cities in the US (Los Angeles, San Francisco, Phoenix and Houston). This is our starting point to assess volatility and intermittency.
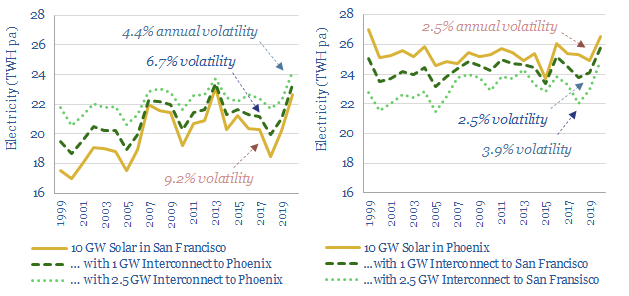
For example, San Francisco receives an average annual insolation of 2,100 kWh/m2/year, however the hour-by-hour standard error is 141% of the hourly average, day-by-day standard error is 50% of the daily average, month-by-month volatility is 30% of the monthly average and year-by-year volatility is 9% of the annual average. Solar insolation is volatile.
It would be helpful for a stable grid to smooth each of these different time-periods of volatility. Hence the data-file models the impact of constructing large inter-connector transmission lines. The model uses a very simple rule: minimize the difference in solar output in the two inter-connected regions. For example if Region A has 10GW of output and region B has 5 GW (e.g., because it is cloudy that day), you could export 2.5 GW from Region A to Region B, and both would now have 7.5 GW.
Can power transmission smooth renewables volatility? Inter-connectors can have a phenomenal impact. Returning to our example of San Francisco, we find that a 2.5 GW inter-connector between 10 GW solar hubs in both San Francisco and Phoenix would smooth San Francisco’s volatility considerably: With the inter-connector, the hour-by-hour standard error is 124% of the hourly average level (down from 141%), day-by-day standard error is 36% of the daily average (down from 50%), month-by-month volatility is 24% of the monthly average (down from 30%) and year-by-year volatility is 4.4% of the annual average (down from 9%).
This is interesting and helpful because we think batteries may find it harder to smooth year-by-year volatility (it requires an enormous battery that only gets to discharge once every 2+ years). These arguments are laid out in our 17-page research report here. Workings are in the different tabs of the data-model linked below, including scripts we have used to manage the gargantuan data-sets, and apologies in advance for the large file size.