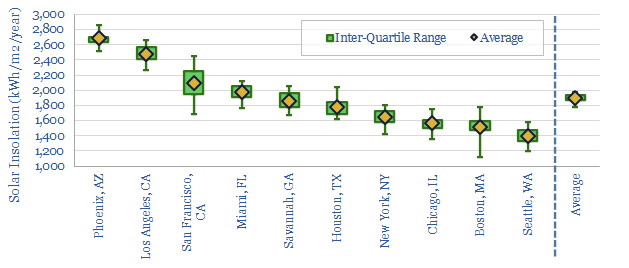
How much does solar energy vary by year in typical locations? To answer this question, this data-file aggregates the average annual volatility of solar (and wind) resources across ten locations, mainly cities, in the United States.
Specifically, we find that the annual volatility of incoming solar radiation reaching ground level tends to vary by +/- 6% per year in a typical city, is 96% correlated across different locations within that city, and 50-70% correlated with other cities in the same region.
Workings are given in the data-file, while underlying data are from the excellent NREL NSRDB resource.
In order to smooth out annual solar volatility, we think the best options are non-correlated (i.e., diversified) energy sources, such as wind (also modelled), and other energy inputs (nuclear, hydro, gas, etc). For example, see our notes here and here.
Another excellent option is long-distance inter-connect power lines, as there is almost no correlation between the different annual insolation reaching, say, San Francisco and Houston, or New York and Seattle. For example, see our notes here and here.
Data in this file are useful for illustrating these arguments, and answering the question of ‘how much does solar energy vary by year?’. We can also run bespoke modelling for TSE clients using the NSRDB data, in which case, please contact us.