This data-file evaluates the holdings of 20 socially responsible ETFs with $150bn of assets, as of 2022. The average fund marketing itself as an “ESG” or “Socially Responsible” has c$10bn of AUM, a 0.3% expense ratio and 500 holdings, of which the ‘top ten’ comprise around 30% on average.
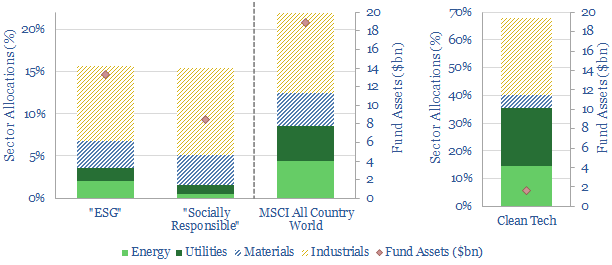
However, is this “socially responsible” or simply underweight energy (which comprises 1.2% of these funds versus 4.5% in the MSCI ACWI), underweight utilities (1.3% of the funds versus 4% of the ACWI) and underweight basic materials (3.4% of the funds, c4-5% of the ACWI)?
On the other hand, the average of these ETFs shares six out of its top ten holdings with the ACWI, including a 6% average allocation to Microsoft, 3.3% Google, 3.3% Apple, 3% Tesla, 2% Nvidia, and other common holdings included J&J, United Health, JPMorgan, Home Depot, Coca Cola.
More constructively, the file also includes a handful of “clean energy” ETFs, whose holdings are a lot more interesting to us. The average of these funds is 15% energy, 20% utilities, and 30% manufacturing of energy and utility inputs. However, this universe is smaller, with the average fund only $1.5bn in assets and more concentrated across an average of 75 holdings.
Recent Commentary: please see our article here. Our own view is that energy transition is not helped by removing capital, but rather, by supporting public companies and private companies that can drive the energy transition.