-
Ten Themes for Energy in the 2020s
This short presentation describes our ‘Top Ten Themes for Energy in the 2020s’. Each theme is covered in a single slide. For an overview of the ideas in the presentation, please see our recent presentation, linked here.
-
Aerial Vehicles: Which Ones Fly?
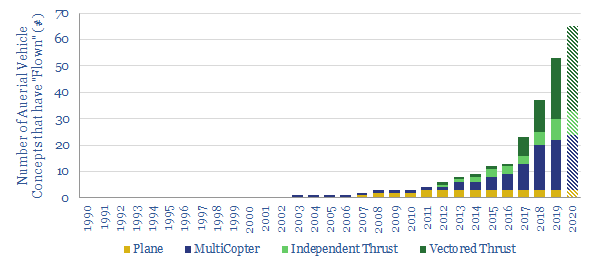
We have updated our database of over 100 companies, which have already flown c50 aerial vehicles (aka “flying cars”), to identify the leading contenders. We categorize each vehicle by fuel type, speed, range, fuel economy and credibility. The data strongly imply aerial vehicles taking off in the 2020s.
-
Drones attack military fuel economy?
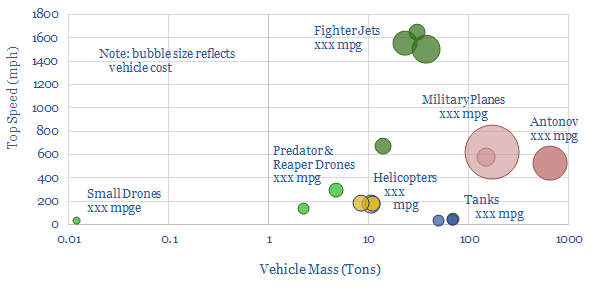
Swarms of drones are emerging as the most devastating military weapon of the 21st century. This was evidenced by the recent attack on Saudi oil infrastructure. But drones’ impact on 0.7Mbpd of global military oil demand could be even more devastating. This data-file quantifies their fuel economy at >1,000 mpge compared to today’s fighter jets,…
-
Aerial Vehicles: why flying cars fly
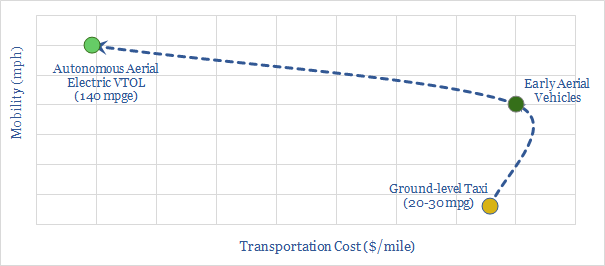
Aerial vehicles will do in the 2020s what electric vehicles did in the 2010s. They will go from a niche technology, to a global mega-trend that no forecaster can ignore. These conclusions stem from a deep-dive analysis into the technology, the fuel economies and the costs, all of which will be transformational. This 20-page written-insight…
-
Aerial Vehicles Re-Shape Transportation Costs?
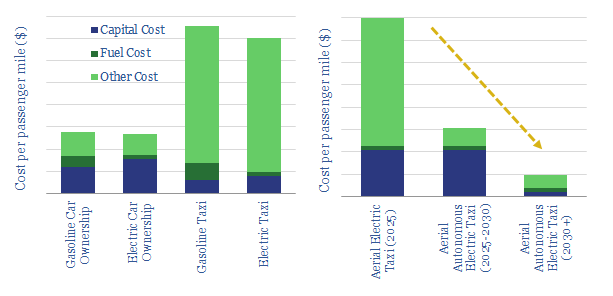
This model calculates costs per passenger-kilometer for transportation, based on input costs. Aerial vehicles could compete with taxis as early as 2025. By the 2030s, their costs can be c60% below car ownership.
-
Who’s Afraid of Aerial Vehicles?
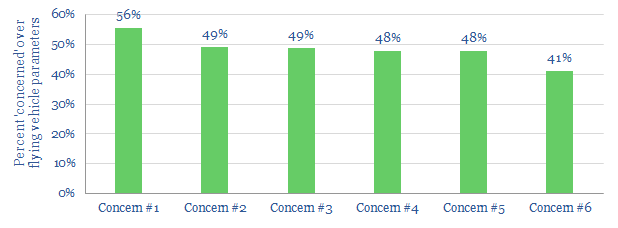
This data-file tabulates consumer attitudes towards aerial vehicles, based on the best perception study we have seen in the technical literature. It shows the influence of geography, income, age, gender, education levels and length of commute; along with top concerns.
-
Vehicles: fuel economy and energy efficiency?
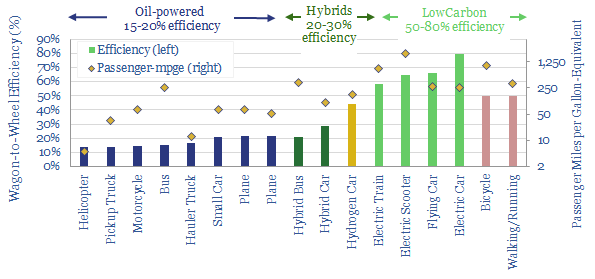
We have quantified the energy efficiency of 14 different transportation technologies, using real-world data and mechanics equations. Electrification raises auto efficiency 4x, from c15-20% to c60-80%. Novel electric technologies are also unlocking unprecedented fuel economies per passenger mile.
Content by Category
- Batteries (89)
- Biofuels (44)
- Carbon Intensity (49)
- CCS (63)
- CO2 Removals (9)
- Coal (38)
- Company Diligence (95)
- Data Models (840)
- Decarbonization (160)
- Demand (110)
- Digital (60)
- Downstream (44)
- Economic Model (205)
- Energy Efficiency (75)
- Hydrogen (63)
- Industry Data (279)
- LNG (48)
- Materials (82)
- Metals (80)
- Midstream (43)
- Natural Gas (149)
- Nature (76)
- Nuclear (23)
- Oil (164)
- Patents (38)
- Plastics (44)
- Power Grids (130)
- Renewables (149)
- Screen (117)
- Semiconductors (32)
- Shale (51)
- Solar (68)
- Supply-Demand (45)
- Vehicles (90)
- Wind (44)
- Written Research (354)
