Biomass accumulation: CO2 fixed by trees and energy crops?

Different plant species fix 3-30 tons of CO2 per acre per year, as they accumulate biomass at 2-40 tons per hectare per year. The numbers matter for biofuels and for nature-based solutions. Hence this data-file compiles technical data into CO2 and biomass accumulation by plant species and by tree species, in different regions globally.


Biomass accumulation and CO2 fixation are quantified in this data-file, based on over 100 technical papers and other industry sources. Biomass accumulation is shown in dry tons per hectare per year. CO2 fixation is in tons per acre per year. Covered trees and crops include Bamboo, Corn, Elephant grass, Eucalyptus, Jatropha, Mangrove, Napier grass, Oak, Oil Palm, Pine, Poplar, Soybean, Spruce, Sugarcane and Teak.

Dry biomass yield for different trees, crops, and grasses.

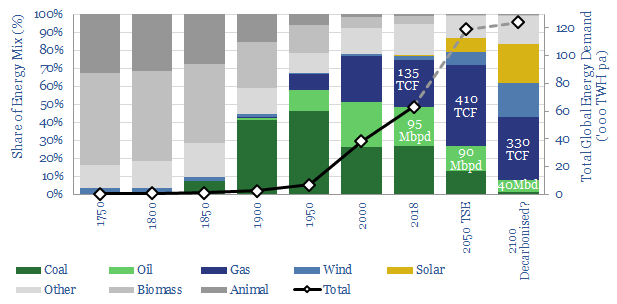
The most likely Roadmap To Net Zero requires a 15-20GTpa CO2 sink using nature-based solutions, which in our base case, involves 3bn acres of reforestation, absorbing 5 tons of CO2 per acre per year. If we fail to hit this target, it is extremely unlikely we ever reach net zero.

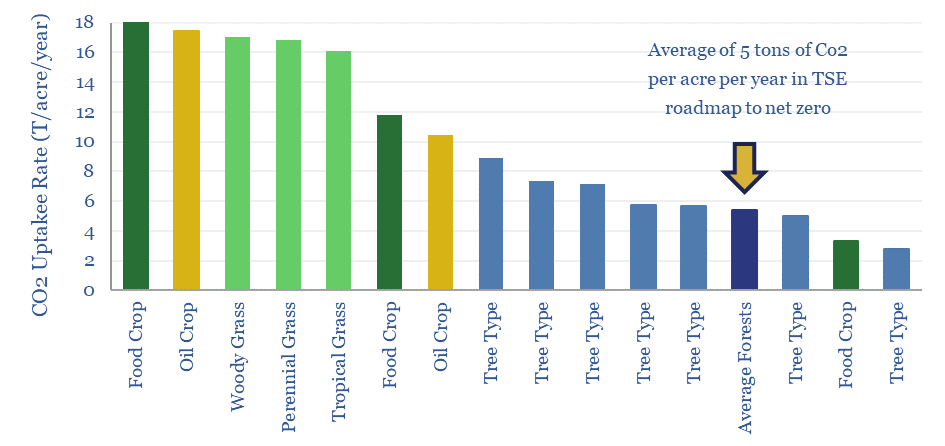
5 tons of CO2 per acre per year is a conservative estimate for afforestation and reforestation initiatives, as CO2 uptake varies by species, by region and by year. Some tree species, especially in tropical climates, fix 7-12 tons of CO2 per acre per year, such as eucalyptus, teak, poplar and mangroves.

Biomass fixation can be 50%-5x higher, at 15-25 dry tons per hectare per year for some food crops and energy crops, fixing 10-20 tons per acre per year of CO2.

But only a portion of that dry biomass is directly usable, for example as corn (45% of the dry corn plant), soybeans (40%), sugar (35%), palm oil (20%), jatropha oil (10%).

When used as food, no net CO2 is sequestered, of course, as the sugars, starches and proteins get metabolized then respired (yielding CO2), or egested and then decomposed (yielding biogas and/or CO2).

When used for energy, usable biomass can be upgraded into biofuels, which then substitute for hydrocarbons. However, fermentation, biodiesel production or upgrading to jet can directly release CO2, or otherwise be so energy intensive, that it would have been more climate-positive simply to reforest the land that was used to grow the energy crops. The answer varies case by case.

The real opportunity in biofuels therefore is to also harness 50-90% of the lignocellulosic energy that is contained in fast-growing grasses and crops, but which is not currently useful, and thus ends up decomposing. This could involve digestion into biogas, combusting sugar ethanol bagasse for power, second generation ethanol, bright green hydrogen, or fascinating options such as biochar.

The data-file tabulates hundreds of data-points from technical papers and industry reports on different tree and grass types. It also covers their growing conditions, survival rates, lifespans, rates of CO2 absorption (per tree and per acre) and their water requirements (examples below).

CO2 uptake rates in forests by tree type

Solar Use within the Oil Industry?

solar use within the oil industry

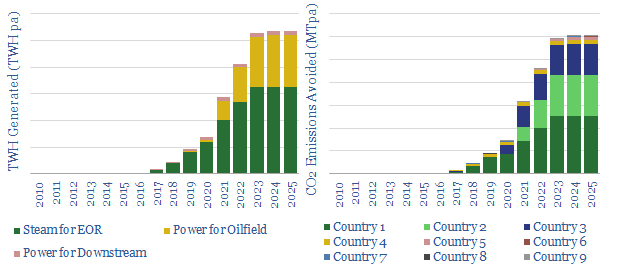
This data-file tabulates 20 solar projects being undertaken within the oil industry, in order to clean up production and reduce emissions. More projects are needed, as the total inventory will obviate <1% of oil industry CO2 by 2025.

For each project, we estimate total TWH of power generation per annum, the CO2 emissions avoided, the timeline; and we also summarize the project details.

Leading examples include the use of concentrated solar for steam-EOR in Oman and California, Solar PV in the Permian, and leading efforts from specific companies: such as Occidental, Shell, Eni and other Majors.

Lubricant Leaders: our top five conclusions

Oil Major lubricant technologies

This data-file presents our “top five” conclusions on the lubricants industry, after reviewing 240 patents, filed by the Oil Majors in 2018. The underlying data on each of the 240 patents is also shown in the ‘LubricantPatents’ tab.

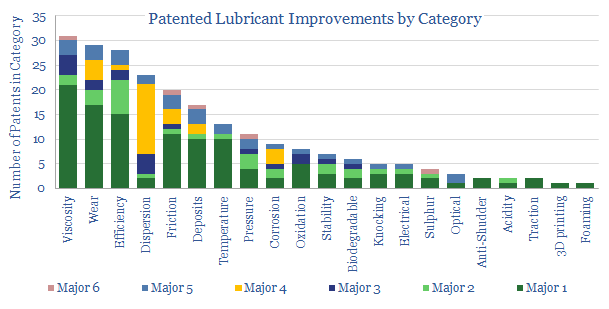
We are most impressed by the intense pace of activity to improve engine efficiencies (chart above), across  over 20 different categories. As usual, we think technology leadership will drive margins and market shares. ‘Major 1’ stands out, striving hardest to gain an edge, by a factor of 2x. ‘ Major 2 has the ‘greenest’ lubricant patents, across EVs and bio-additives. Major 4 has the single most intriguing new technology in the space.

The relative number of patents into Electric Vehicle Lubricants is also revealing. It shows the Majors’ true attitudes on electrification, in a context where they are incentivised to sell new products into the EV sector. Our lubricant demand forecasts to 2050 are also noted.

Can super-computers lower decline rates?

can computers lower oil production decline rate

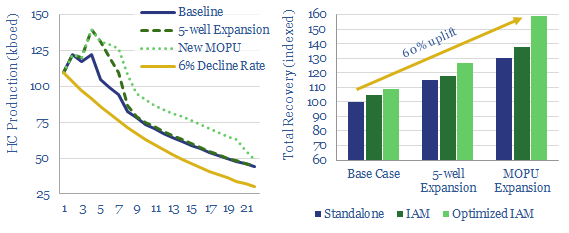
Advanced reservoir modelling can stave off production declines at complex offshore assets. This data-file illustrates how, tabulating production estimates based on a technical paper published by Eni, an industry leader in applying high-speed computing power in its upstream operations.


Specifically, the paper simulates an offshore field-cluster in a single, Integrated Asset Model that covers 31 wells, drilled into 3 reservoirs (each is modelled in detail, with a total of 1.9M reservoir cells), 34 pipes, 4 oil platforms and 3 delivery points. Each iteration of this model takes an average of 3.5-hours to run.

Production can be uplifted by 60% according to the simulation, both in terms of EUR and in terms of year 5-7 production rate. 9pp of the uplift is achieved by simple reservoir optimisation. Another 21pp of uplift is achieved by identifying the key bottleneck, and building a new separation & boosting platform to alleviate it. A further 29pp of uplift comes from optimising the development plan for the new platform.

Emerging digital technologies appear to be keeping LT oil-markets better supplied than many expect, with production upside for the industry’s technology-leaders.

Shale: Upgrade to Fiber?

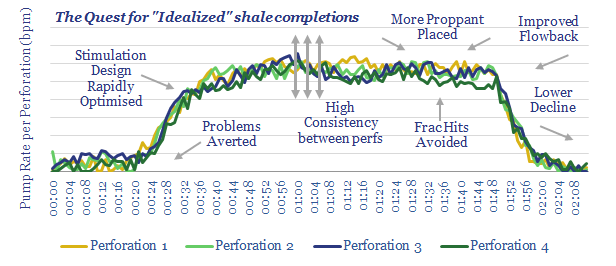
DAS Quest for Idealized Completion

Completing a shale well depends on over 40 variables. Each one can be optimised using data. It follows that next-generation data could deliver next-generation shale productivity.

This note focuses on the most exciting new data methodology we have seen across the entire shale space: distributed acoustic sensing (DAS) using fiber-optic cables. It has now reached critical mass.

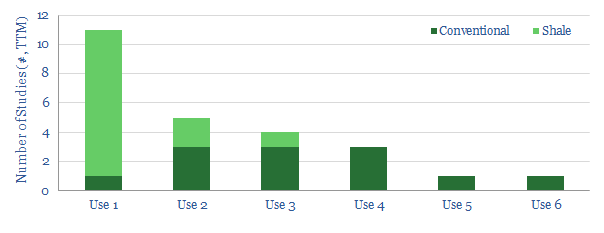
DAS will have six transformational effects on the shale industry. Leading operators and service companies are also assessed.

DAS. At the cutting edge in shale?

fiber-optic cables for DAS

This data-file summarises 25 of the most recent technical papers around the industry, using fiber-optic cables for Distributed Acoustic Sensing (DAS). The technology is hitting critical mass to spur shale productivity upwards.


For each study, our data-file tabulates the company involved, the country of application, the specific purpose and a short summary of findings.

Technical data are also tabulated from some of these papers, including for warm-back analysis, perforation design and cluster flow-allocations.

Oil Companies Drive the Energy Transition?

Disrupt Agriculture Energy Opportunities

There is only one way to decarbonise the energy system: leading companies must find economic opportunities in better technologies. No other route can source sufficient capital to re-shape such a vast industry that spends c$2trn per annum. We outline seven game-changing opportunities. Leading energy Majors are already pursuing them in their portfolios, patents and venturing. Others must follow suit.

Our Top Technologies for IMO 2020

Refineries become bio-refineries

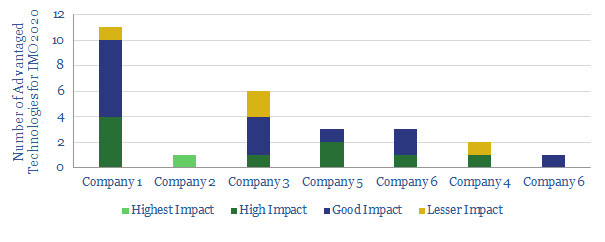
So far we have reviewed 450 patents in the downstream oil and gas industry (ex-chemicals). A rare few prompted an excited thought — “that could be useful when IMO 2020 comes around”.  Hence, this data-file summarises the top 25+ proprietary technologies we have seen to capitalise on the opportunity. They are summarised and “scored” by company.

We will also provide you with updates of this file, as we continue reviewing patents and technical papers.

Can technology revive offshore oil?

Can technology revive offshore oil

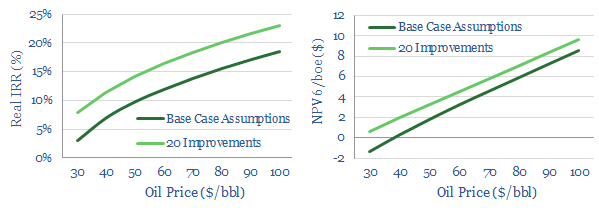
The appetite to invest in new offshore oil projects has been languishing, due to fears over the energy transition, a preference for share-buybacks, and intensifying competition from short-cycle shale. So can technology revive offshore and deep-water? This note outlines our ‘top twenty’ opportunities. They can double deep-water NPVs, add c4-5% to IRRs and improve oil price break-evens by $15-20/bbl.

Eni Slurry Technology. A leader for IMO 2020?

Eni Slurry Technology

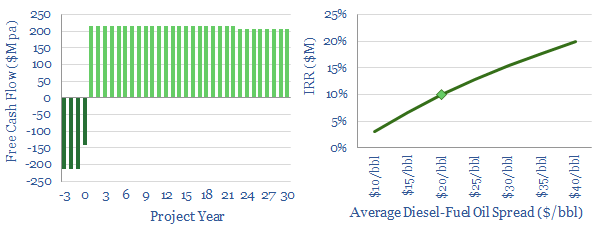
This data-file models the economics of Eni’s Slurry Technology, for hydro-converting heavy crudes and fuel oils into light products. It is among the top technologies we have reviewed for the arrival of IMO 2020 sulfur regulation, achieving >97% conversion of heavy fractions. The catalyst is stable and handles even ultra-heavy inputs. We see 10-20% IRRs at $20-40/bbl upgrading spreads. The data-file also summarises EST’s adoption in refineries to-date, future plans, and technical details of the EST process.

Copyright: Thunder Said Energy, 2019-2025.