-
US shale: outlook and forecasts?

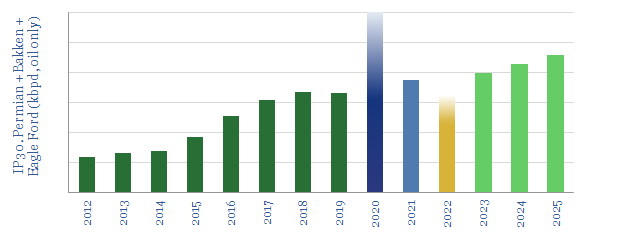
This model sets out our US shale production forecasts by basin. It covers the Permian, Bakken and Eagle Ford, as a function of the rig count, drilling productivity, completion rates, well productivity and type curves. US shale likely adds +1Mbpd/year of production growth from 2023-2030, albeit flatlining in 2024, then re-accelerating on higher oil prices?
-
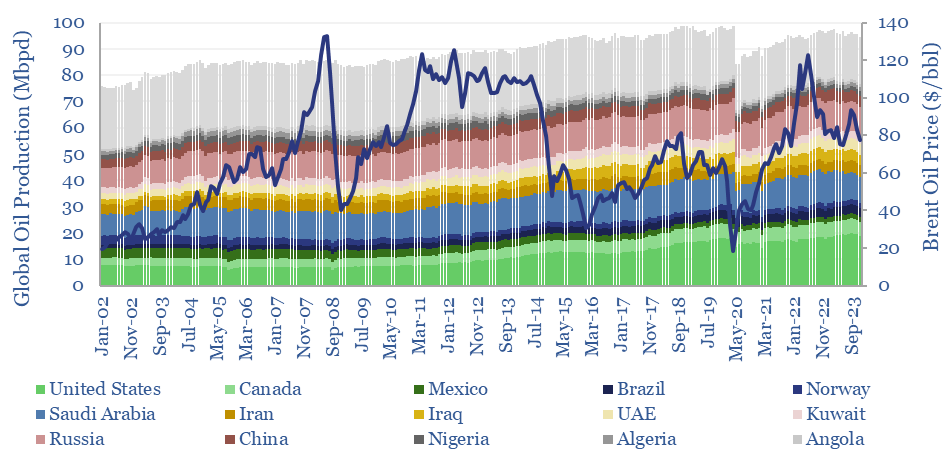
Global oil production by country?

Global oil production by country by month is aggregated across 35 countries that produce 80kbpd of crude, NGLs and condensate, explaining >96% of the global oil market. Production has grown by +1Mbpd/year in the past two-decades, led by the US, Iraq, Russia, Canada. Oil market volatility is usually low, at +/- 1.5% per year, of…
-
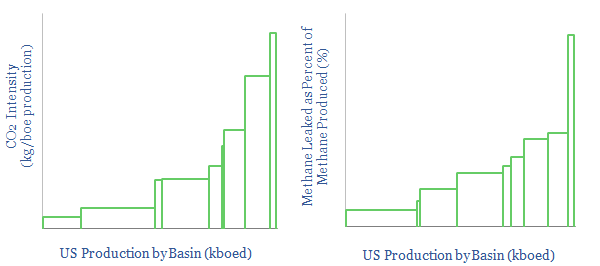
US CO2 and Methane Intensity by Basin

The CO2 intensity of oil and gas production is tabulated for 425 distinct company positions across 12 distinct US onshore basins in this data-file. Using the data, we can aggregate the total upstream CO2 intensity in (kg/boe), methane leakage rates (%) and flaring intensity (in mcf/boe), by company, by basin and across the US Lower 48.
-
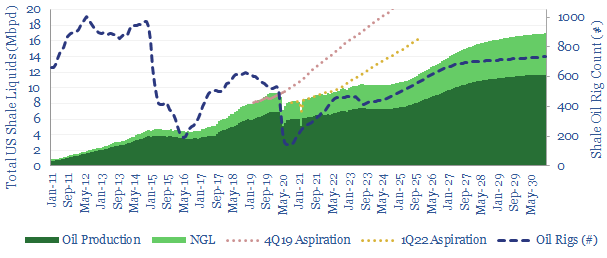
Shale productivity: snakes and ladders?

Unprecedented high-grading is now occurring in the US shale industry, amidst challenging industry conditions. This means production surprising to the upside in 2020-21 and disappointing during the recovery. Our 7-page note explores the causes and consequences of the whipsaw effect.
-
Chevron: SuperMajor Shale in 2020?

SuperMajors’ shale developments are assumed to differ from E&Ps’ mainly in their scale and access to capital. Access to superior technologies is rarely discussed. But new evidence is emerging. This note assesses 40 of Chevron’s shale patents from 2019, showing a vast array of data-driven technologies, to optimize every aspect of shale.
-
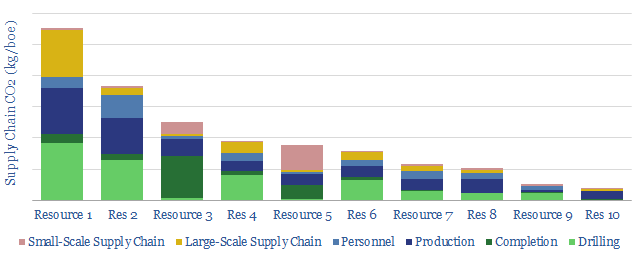
CO2 Intensity of Oilfield Supply Chains

What is more CO2-intensive: the c4,000 truck trips needed to complete a shale well, or giant offshore service vessels (OSVs), which each consume >100bpd of fuel? This data-file quantifies the CO2 intensity of supply-chains, for 10 different resource types, as a function of 30 input variables.
-
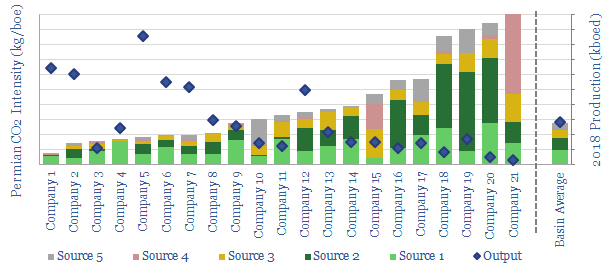
Permian CO2 Emissions by Producer

This data-file tabulates Permian CO2 intensity, based on regulatory disclosures from 20 of the leading producers to the EPA. The data are disaggregated by company, across 18 different categories, such as combustion, flaring, venting, pneumatics, storage tanks and methane leaks. There are opportunities to lower emissions.
-
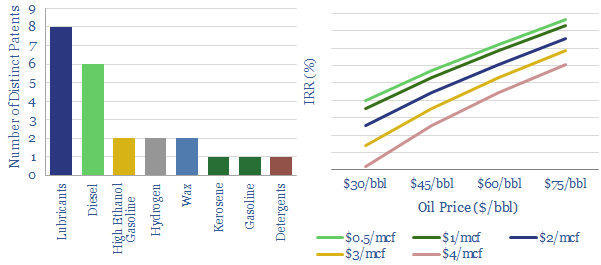
US Shale Gas to Liquids?

Shell filed 42 distinct new patents around GTL in 2018. This data-file reviews them, showing how the broad array of GTL products confers defensiveness and downstream portfolio benefits. Hence, we have modeled the economics of “replicating” Pearl GTL in Texas. Our base case is a 11% IRR taking in 1.6bcfd of stranded gas from the…
-
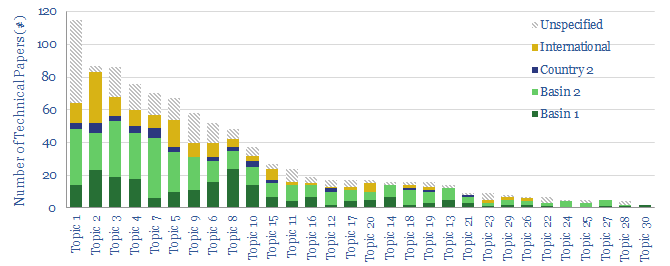
The cutting edge of shale technology?

This data-file reviews 950 technical papers from the shale industry in 2018-2020, to identify the cutting edge of shale technology. The trends show an incredible uptick in completion design, frac fluids, EOR and machine learning. Each paper is summarized and categorized. The file also shows which companies and services have a technology edge.
-
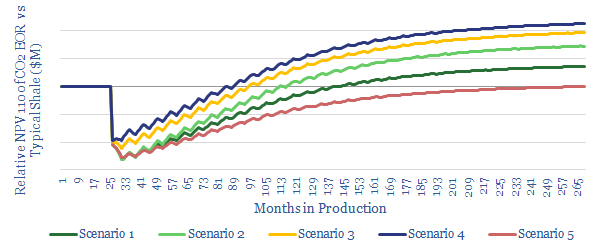
CO2-EOR in Shale: the economics

We model the economics for CO2-EOR in shales, after interest in this topic spiked 2.3x YoY in the 2019 technical literature. We see 15% IRRs in our base case, creating $1.6M of incremental value per well, uplifting type curves by 1.75x. Greater upside is readily possible. Most exciting is the prospect for Permian EOR to…
Content by Category
- Batteries (87)
- Biofuels (42)
- Carbon Intensity (49)
- CCS (63)
- CO2 Removals (9)
- Coal (38)
- Company Diligence (90)
- Data Models (816)
- Decarbonization (159)
- Demand (108)
- Digital (56)
- Downstream (44)
- Economic Model (197)
- Energy Efficiency (75)
- Hydrogen (63)
- Industry Data (273)
- LNG (48)
- Materials (79)
- Metals (71)
- Midstream (43)
- Natural Gas (146)
- Nature (76)
- Nuclear (22)
- Oil (162)
- Patents (38)
- Plastics (44)
- Power Grids (123)
- Renewables (149)
- Screen (112)
- Semiconductors (30)
- Shale (51)
- Solar (67)
- Supply-Demand (45)
- Vehicles (90)
- Wind (43)
- Written Research (345)