Vehicle fuel economy and energy efficiency are quantified in this data-file, looking across different transportation types: cars, trucks, buses, hybrids, electric vehicles (EVs), hydrogen cars, planes, trains, helicopters, plus other smaller vehicles such as bicycles, scooters, motor-cycles and simply ‘walking’.
Our numbers are built up for each category, in kWh-per-mile, miles-per-gallon, energy efficiency percentages and ultimate CO2 intensity per mile of travel. In turn, these numbers are built up from physics calculations, enthalpy calculations and technical disclosures of underlying companies.
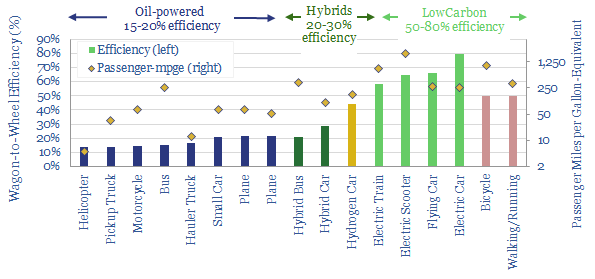
A good rule of thumb is that a passenger car achieves 20-40mpg and 15-20% efficiency, depending on its size; a bus or truck achieves 5-10 vehicle miles per gallon, but this is equivalent to up to 50-250 passenger-equivalent miles per gallon, because of a higher load factor; and likewise a plane might achieve 0.2-0.5 vehicle miles per gallon, translating into 50-70 passenger miles per gallon, when you think of a plane as just a flying bus.
Electrification generally offers a c4x gain in vehicle fuel economy and energy efficiency, especially for ground-level vehicles, increasing efficiency from c15-20% on conventional oil-powered vehicles to c60-80% on electric vehicles. Hybrids and hydrogen also yield modest efficiency improvements.
Smaller vehicles are surprisingly exciting. This is just physics, but a bicycle achieves an effective fuel economy of 1,000 miles per gallon-equivalent, which is about 8x better than an electric vehicle, and even 3x better than walking (note here). Moreover, an emerging class of electric transportation technologies is fast, convenient and yet achieve 4-120x efficiency gains per passenger mile (note here).
Further data dis-aggregating the CO2 intensity per mile of electric vehicles versus ICE cars, depending on how they are powered, is linked here.