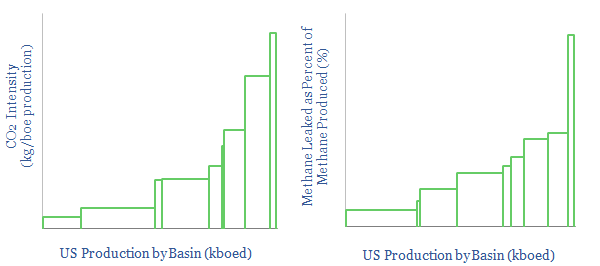
The CO2 intensity of oil and gas production is tabulated for 500 distinct company positions across 12 distinct US onshore basins in this data-file. Using the data, we can break down the upstream CO2 intensity (in kg/boe), methane leakage rates (%) and flaring intensity (mcf/boe), by company, by basin and across the US Lower 48.
In this database, we have aggregated and cleaned up 1 GB of data, disclosed by the operators of 500 large upstream oil and gas acreage positions. The data are reported every year to the US EPA, and made publicly available via the EPA FLIGHT tool.
The database covers 85% of US onshore oil and gas from 2022, including 8.8Mbpd of oil, 100bcfd of gas, 25Mboed of total production, 462,000 producing wells, 800,000 pneumatic devices and 62,000 flares. All of this is disaggregated by acreage positions, by operator and by basin. It is a treasure trove for energy and ESG analysts.
CO2 intensity. The mean average upstream oil and gas operation in 2022 emitted 10kg/boe of CO2e. Across the entire data-set, the lower quartile is below 3kg/boe. The upper quartile is above 12kg/boe. The upper decile is above 20kg/boe. And the upper percentile is above 70kg/boe. There is very heavy skew here (chart below).

The main reasons are methane leaks and flaring. The mean average asset in our sample has a methane leakage rate of 0.16% in 2022 (down from 0.21% in 2021) and a flaring intensity of 0.024 mcf/boe (down from 0.028 mcf/boe in 2021). There is a growing controversy over methane slip in flaring, which also means these emissions may be higher than reported. Flaring intensity by basin is charted below.

US CO2 intensity has been improving since 2018. CO2 intensity per basin has fallen by 21% over the past three years, while methane leakage rates have fallen by 22%. Activity has clearly stepped up to mitigate methane leaks.

Progress was made in 2022 in switching out bleeding pneumatic devices. Comparing 2022 vs 2021, our data-file contains 33,000 more wells (+8%), yet -3,100 fewer high-bleed pneumatic devices (-35%) and 14,000 fewer intermediate-bleed pneumatic devices (-3%). You can see who has most bleeding pneumatics still to replace in the data-file.
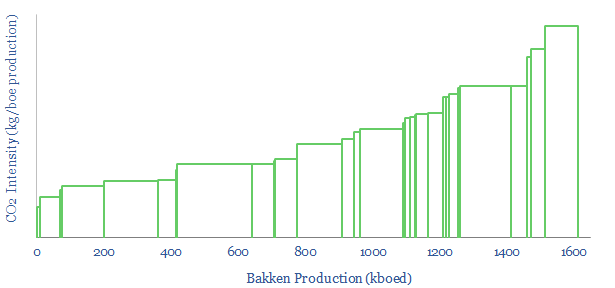
Most interesting is to rank the best companies in each basin, using the granular data, to identify leaders and laggards (chart below). A general observation is that larger, listed producers tend to have lower CO2 intensity, fewer methane leaks and lower flaring intensity than small private companies. Half-a-dozen large, listed companies stand out, with exceptionally low CO2 intensities. Please consult the data-file for cost curves (like the one below).

Methane leaks and flaring intensity can also be disaggregated by company within each basin. For example, the chart below shows some large Permian producers effectively reporting zero flaring, while others are flaring off over 0.1 mcf/bbl.

All of the underlying data is also aggregated in a useful summary format, across the 500 different acreage positions reporting in to EPA FLIGHT, in case you want to compare different operators on a particularly granular basis.
