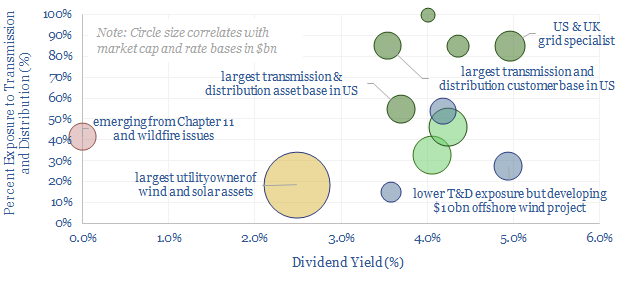
This data-file is a screen of US electric utilities, with a focus on transmission and distribution. The data-file covers a dozen companies, which control around 30% of US generation capacity (in GW), transmission (in miles), distribution (in miles) and electricity sales (in million MWH). We wonder whether there is increasing upside for transmission and distribution as part of the energy transition?
A key conclusion from our research into the energy transition is the upside in the grid, with total investment accelerated from around $1trn pa to $3-4trn pa. The reasons are summarized here. We wonder if this creates hidden upside for utilities that control transmission and distribution infrastructure?
Regulated utilities are “the opposite” of conventional energy companies, which the market has tended to punish for increasing their capex. Regulated utilities earn a pre-agreed rate of return on equity, usually 9-11%. Thus higher spending translates into higher future earnings.
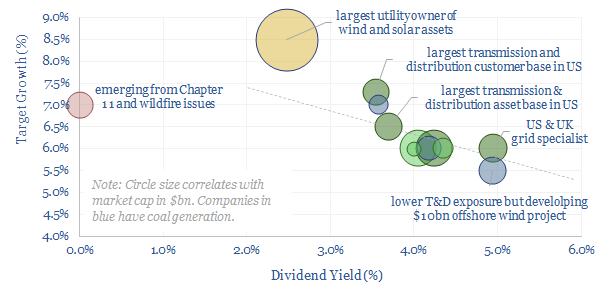
Our data-file shows several companies planning 20-50% step-ups in T&D spending over the coming half-decade. The average company is trading at a 3.5% dividend yield today and targeting 6.5% annual earnings growth, as its rate base expands.

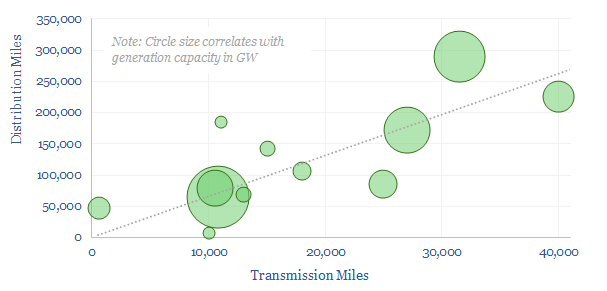
Who are the largest companies in US power transmission and distribution? We have aggregated data below. We think this sample comprises 35% of all the transmission infrastructure and 25% of the distribution infrastructure in the US.

The full data-file contains details on each company. The average company has been in operation for 80-years, employs 18,000 people, has over 25 GW of generation assets, 15,000 transmission miles, 100,000 distribution miles, 8M customers, $20bn pa of revenues, c10% net margins, 8.5% ROE and 3.5% dividend yields.
We have also written a 4-7 line summary of each company. Common themes for these US electric utilities include rising capex, especially for renewables, the phase out of coal, building out electric vehicle infrastructure and a target of reaching net zero by 2050 or before.
