The volatility of wind generation is illustrated in this data-file, by aggregating the data for a large wind project in Australia, every five minutes, across an entire calendar year. Intra-day and inter-day volatility is 30-60% higher than for solar. 2-6 day feasts and famines are hard to backstop with batteries. Solar also cannibalizes wind?
Stockyard Hill is a 149 turbine, 511MW wind farm in New South Wales, Australia, located approximately 150km west of Melbourne and 35km west of Ballarat, Victoria. As a case study for large-scale wind generation, we have evaluated its output, every 5-minutes, over the course of 2023 (105,000 data-points), using data from AEMO.
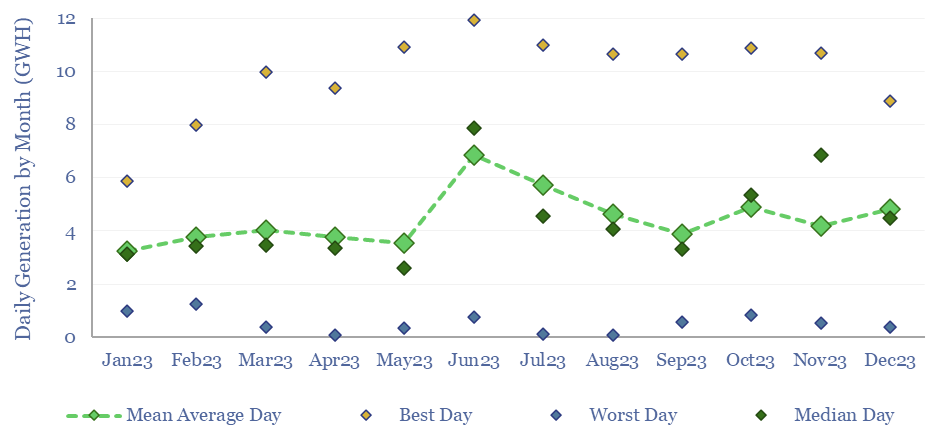
The project’s average utilization factor across the year was 37%, varying from 0% on the worst day to 98% in the best day, higher than in our usual onshore wind models. Seasonally, the utilization factor was lowest in January, at 27% and highest in June at 56%, although this may simply be due to random weather fluctuations.
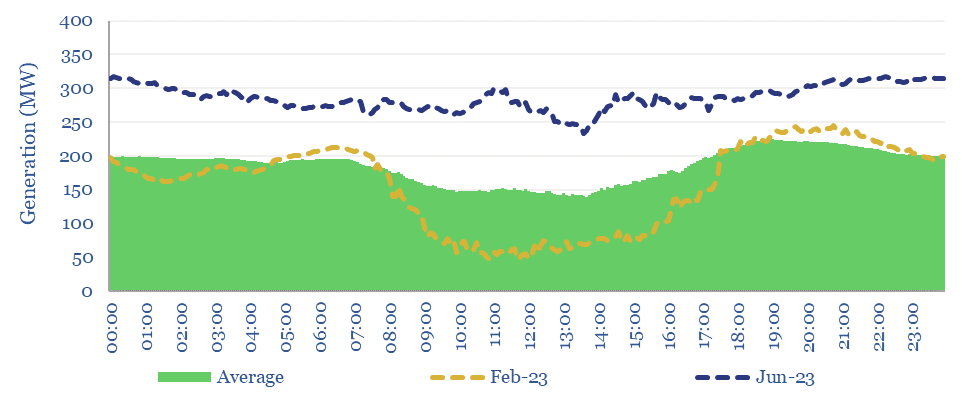
Solar versus wind? Over the entire year, wind output at Stockyard Hill was 20% lower than average between 10am and 2pm, i.e., the hours of peak solar generation (chart below). In January/February, wind output was 50% lower during this time-window. This strongly suggests that wind is being curtailed when the grid is already full of solar.
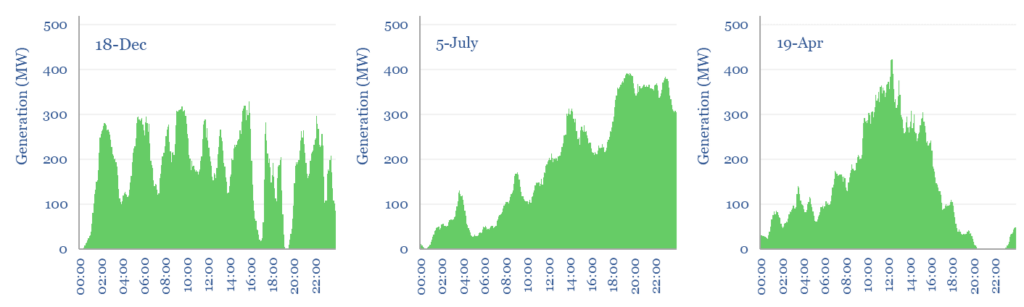
Short-term volatility also appears to be higher for wind than for solar. The 5-minute-by-5-minute volatility of a typical large solar installation is +/- 5%, while for this particular wind installation it is +/- 8%, and as high as +/- 10% in September/October. The volatility across three typical (median) days is shown below.
Daily volatility also appears to be higher for wind than for solar. The daily standard error for a typical large solar installation is +/-50%, while for this particular wind installation, it is +/- 65%. One reason for the higher volatility is that on the best days, wind runs flat out, while on the worst days, wind does not run at all (chart below).
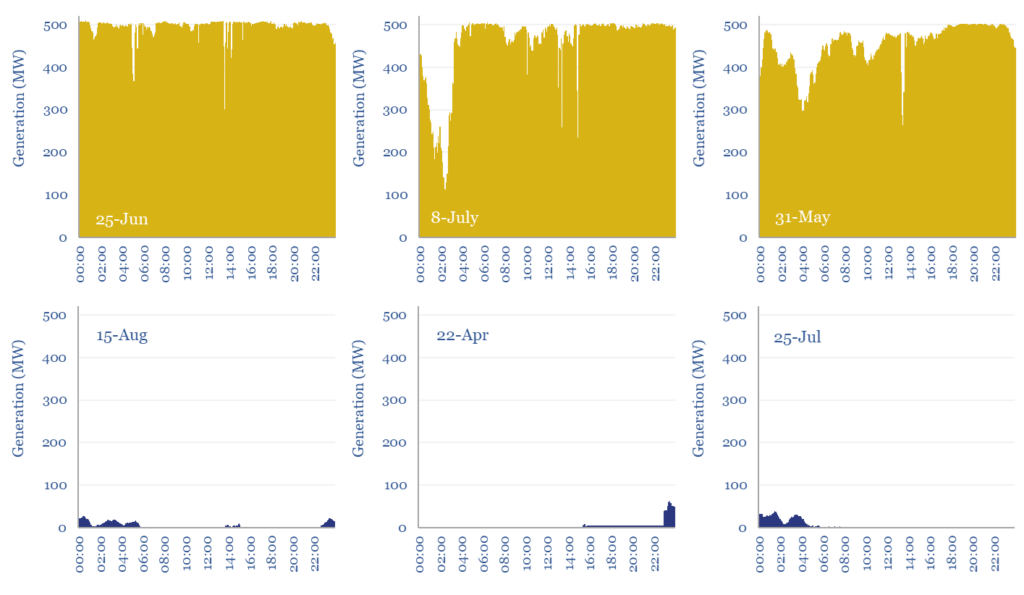
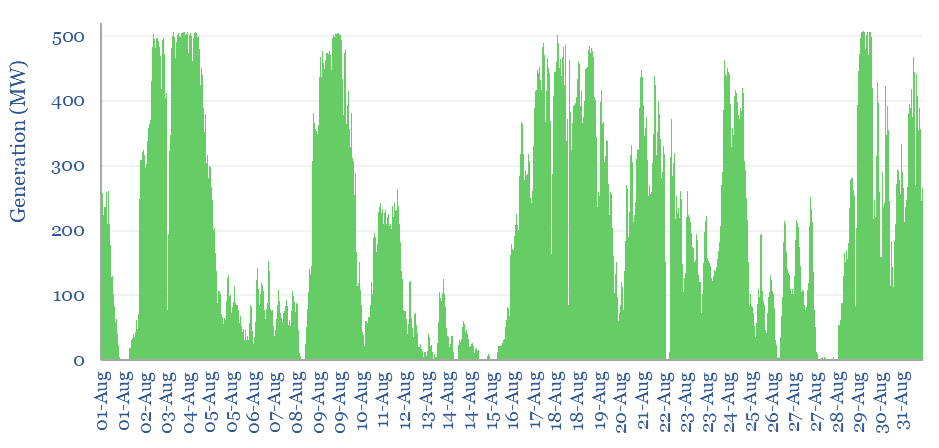
The biggest challenge for integrating wind into power grids, we think, are the long gaps (aka dunkelflaute), seen in this data-file. Generation was nil for five consecutive days in May-2023, 4-days in August-2023 (chart below), 4-days in October, 3-days in March, 3-days in April, 3-days in November, 2-days in July, 2-days in September. 2-6 day feasts and famines are hard to backstop with batteries, which is why we think gas-fired backups entrench. All of the data are in the data-file.