Wind turbine capacity factors average 26% globally. But they vary from c20% in non-windy countries to 45% in the windiest countries. And they also vary within countries, with a normal distribution and a standard deviation of 7-12%. This data-file maps capacity factors of wind power generation.
Wind turbine capacity factors, aka wind turbine load factors, denote the utilization rate of a wind turbine. For example, if a 10MW wind turbine ran flat out for 24-hours per day, for 365-days per year, then it would generate 87.6 GWH pa. Conversely, if it only generates 25 GWH over the course of a year, then its capacity factor would be 28.5%.
Capacity factors are a crucial economic input when calculating the levelized costs of onshore wind, offshore wind and whether wind is inflationary versus deflationary when ramping renewables and displacing hydrocarbons.
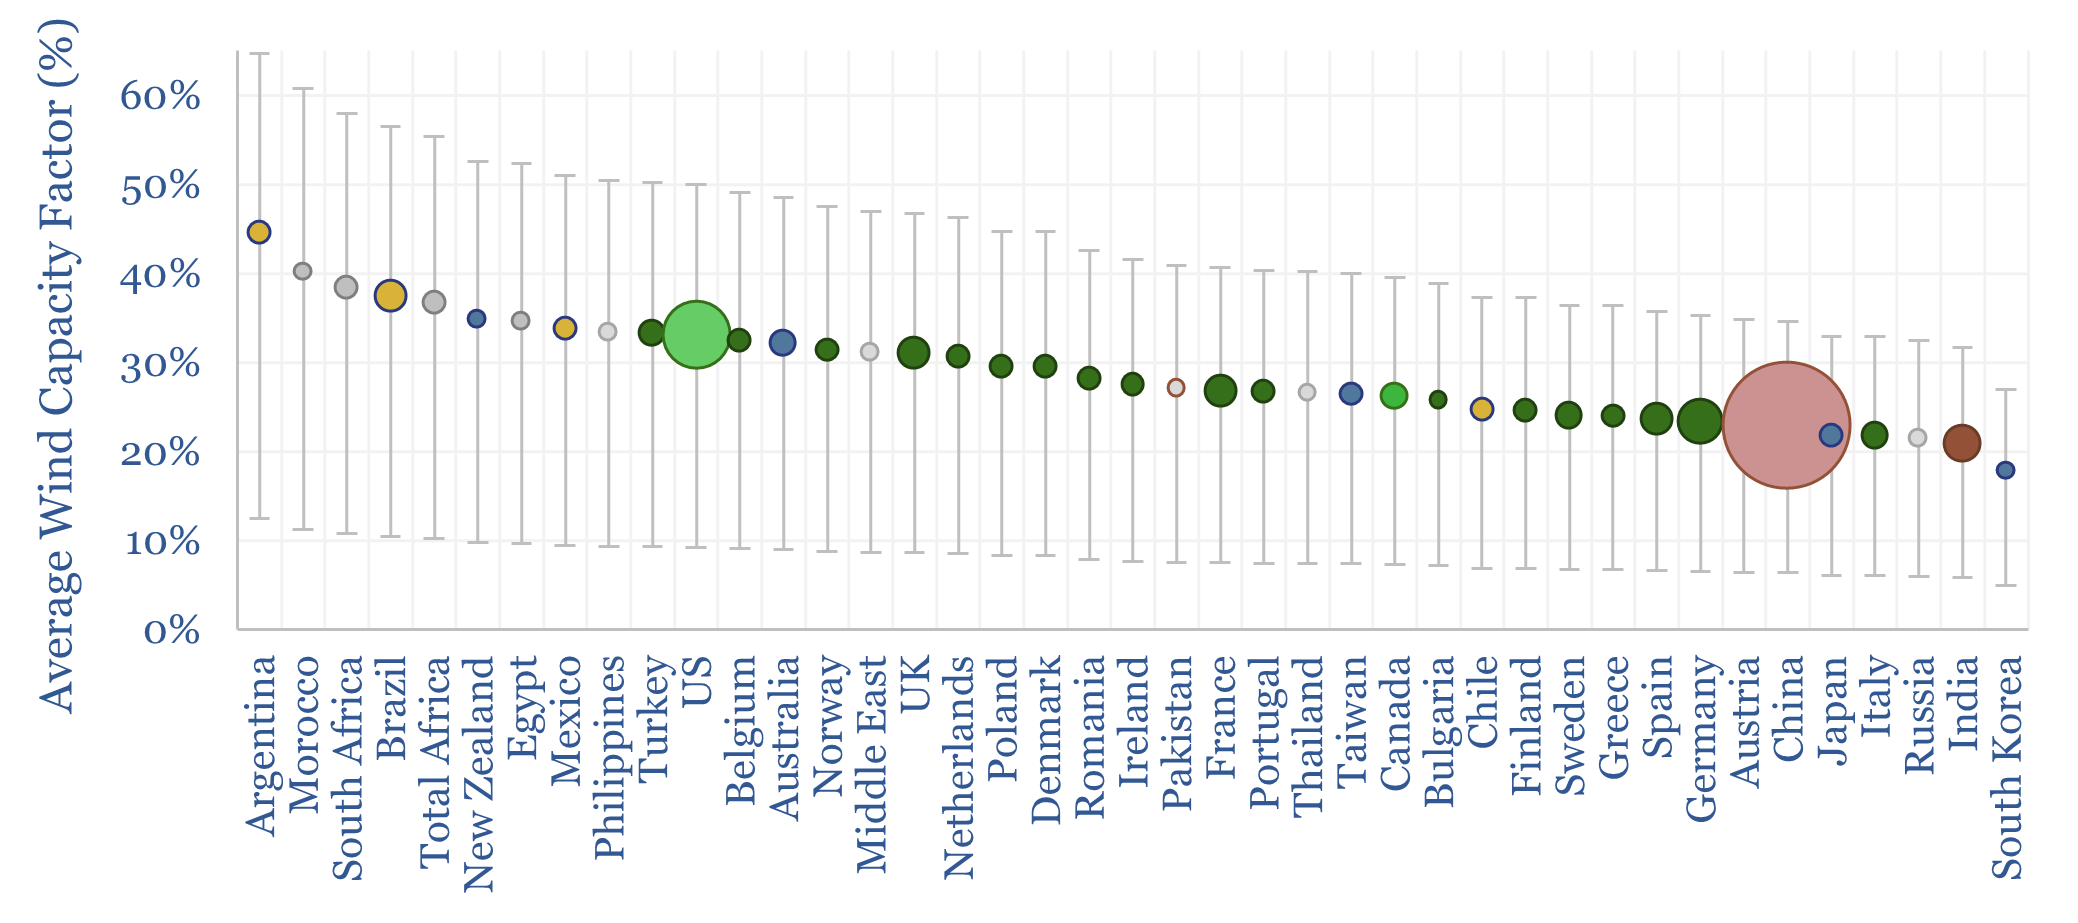
Wind turbine capacity factors are tabulated in this data-file. In the first tab, we plot the average capacity factor across major countries, using helpful data from the Energy Institute.
Some of the windiest countries, such as Argentina, Morocco, South Africa and Brazil have average utilization factors around 40%; which is 2x higher than the least windy countries, such as South Korea, India, Russia, Italy and Japan at c20%.
Wind turbine capacity factors also vary within countries, as shown in the chart below, which captures 1,300 wind farms operating in the United States in 2023, with a weighted average load factor of 33%.
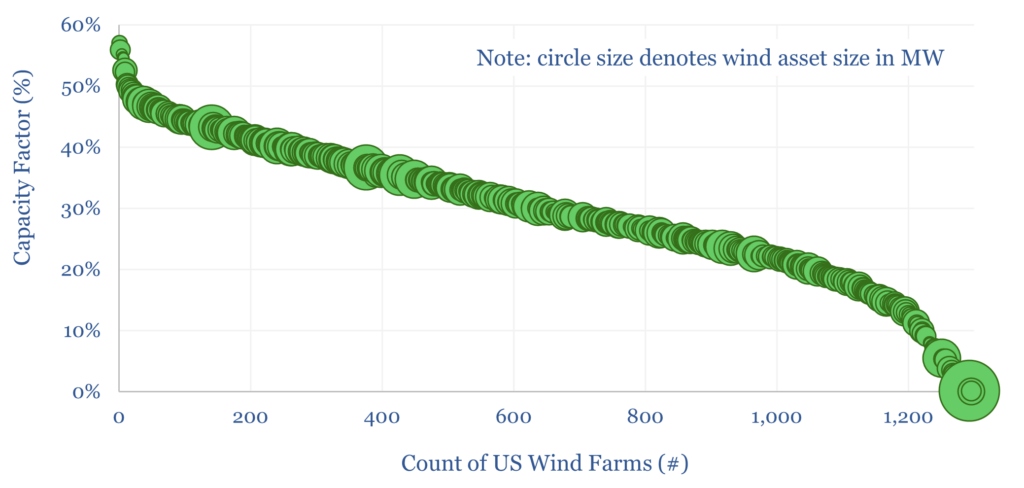
Using the granular data, the data-file thus shows how the capacity factors of wind farms vary by state and by start-up year. Interestingly, the average capacity factor rose steadily since pre-2010 but does seem to have peaked in 2018?
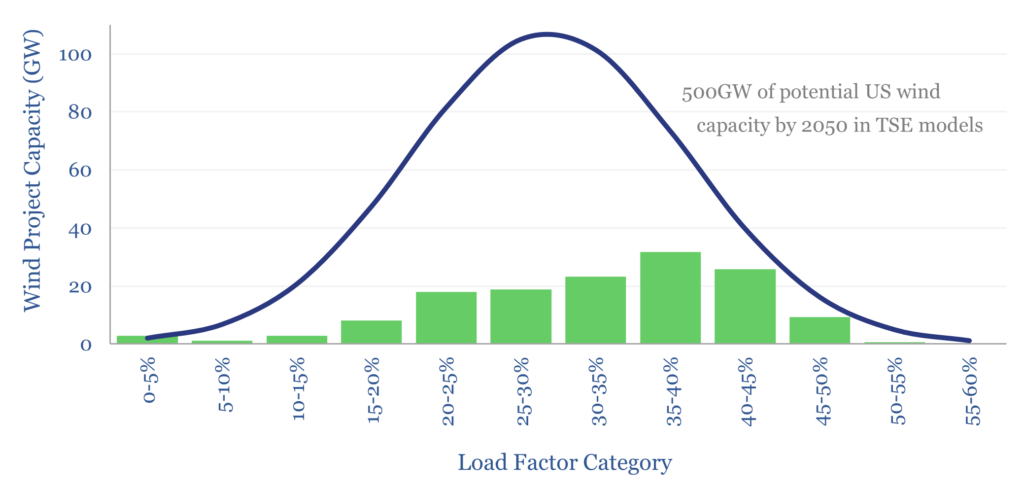
One possibility, amidst the variability, is that the locations that have been chosen for wind farms to date are skewed towards the better locations, while further locations would tend to be less good. This is supported by the chart below, which overlays the locations of US wind farms built to-date across a fitted normal distribution of US wind resources.
Similar data, breakdown of wind load factors, facility by facility, are given in two further tabs, for Brazil and Australia. In addition, for more granular data, into wind farm generation, at 5-minute intervals across an entire year, please see our case study of the Stockyard Hill wind farm in Australia.