Search results for: “commodity prices”
-
Commodity intensity of global GDP in 30 key charts?
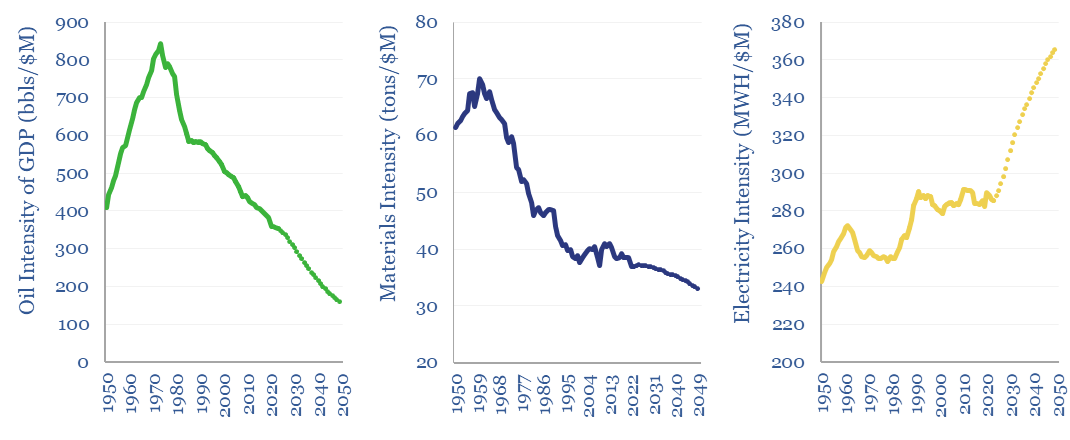
The commodity intensity of global GDP has fallen at -1.2% over the past half-century, as incremental GDP is more services-oriented. So is this effect adequately reflected in our commodity outlooks? This 4-page report plots past, present and forecasted GDP intensity factors, for 30 commodities, from 1973->2050. Oil is anomalous. And several commodities show rising GDP…
-
Global electricity prices vs. CO2 intensities?
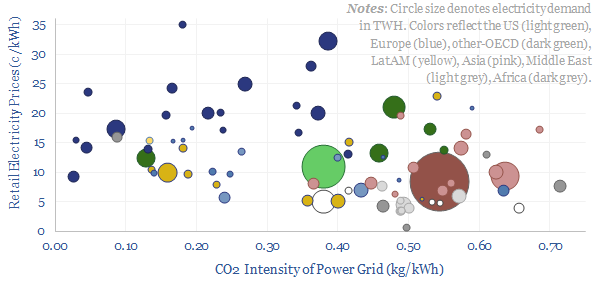
Retail electricity prices average 11c/kWh globally, of which 50-60% is wholesale power generation, 25-35% is transmission and 10-20% covers other administrative costs of utilities. The average CO2 intensity of the global average power grid is 0.45 kg/kWh. Variations are wide. And there is a -35% correlation between electricity prices vs CO2 intensities in different countries…
-
Residential energy prices: reasons for optimism?
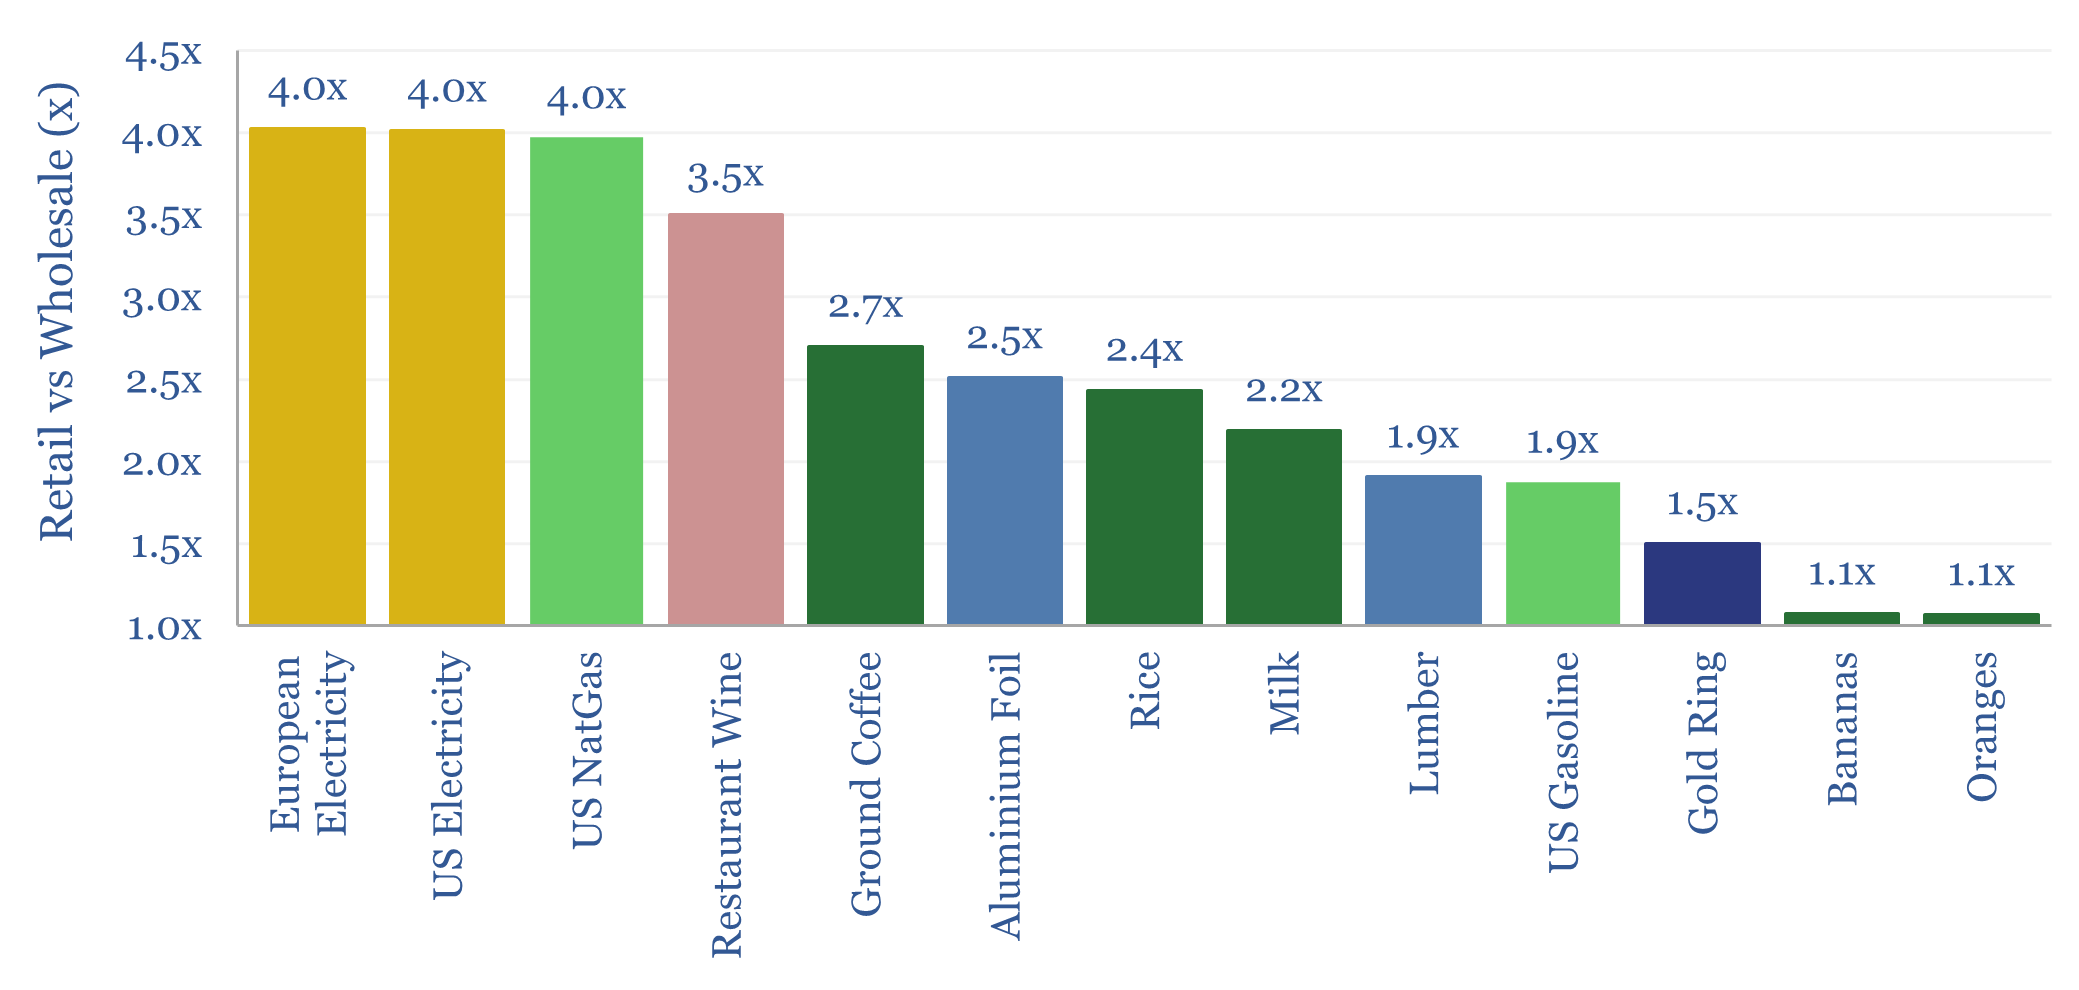
Residential energy prices tend to run 4x higher than underlying wholesale energy prices. This is a very wide margin, as by contrast, typical commoditized products in supermarkets are usually only marked up by about 2x, compared to their wholesale prices. Today’s data-file compares retail prices vs wholesale prices across a dozen different categories. A remarkable…
-
California electricity prices by hour?
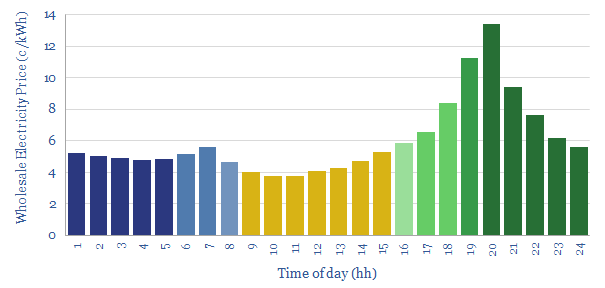
In 2023, power grids with c20-30% solar variation tend to have intra-day spreads of 9c/kWh, between peak wholesale electricity prices at 8pm and trough prices at 10am. Unusually, night-time electricity prices are 40% higher than day-time prices. This data-file quantifies California electricity prices, on a wholesale basis, at a sample of grid nodes, looking hour…
-
Gas peaker plants: the economics?
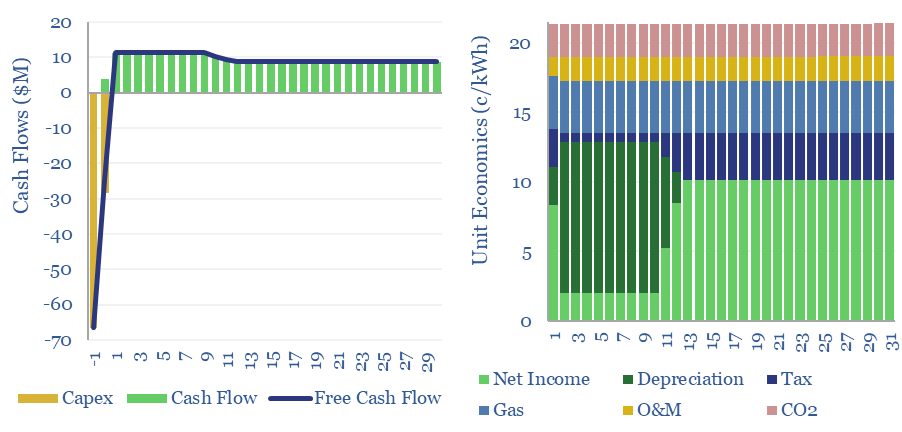
Gas peaker plants run at low utilizations of 2-20%, during times of peak demand in power grids. A typical peaker costing $950/kW and running at 10% utilization has a levelized cost of electricity around 20c/kWh, to generate a 10% IRR with 0.5 kg/kWh of CO2 intensity. This data-file shows the economic sensitivities to volatility and…
-
Lithium ion battery costs: materials and manufacturing?
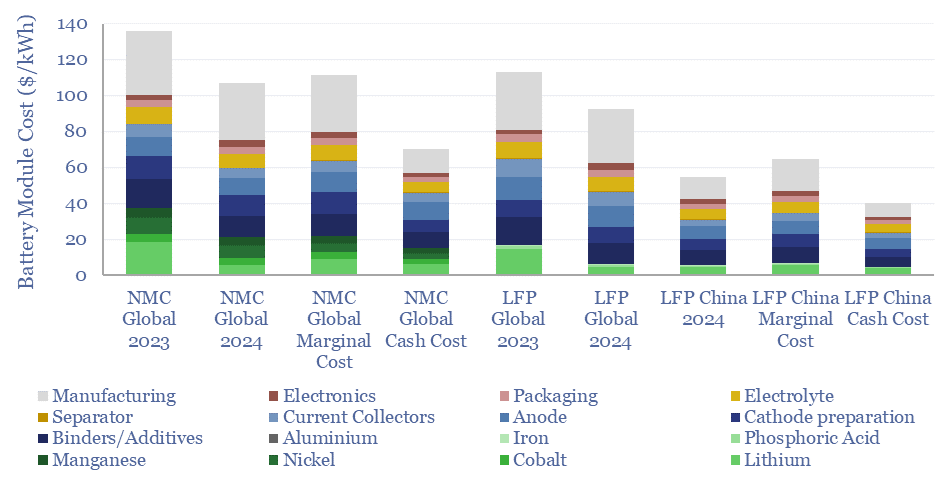
Lithium ion battery costs range from $40-140/kWh, depending on the chemistry (LFP vs NMC), geography (China vs the West) and cost basis (cash cost, marginal cost and actual pricing). This data-file is a breakdown of lithium ion battery costs, across c15 materials and c20 manufacturing stages, so input assumptions can be stress-tested.
-
Jevons Paradox: what evidence for energy savings?
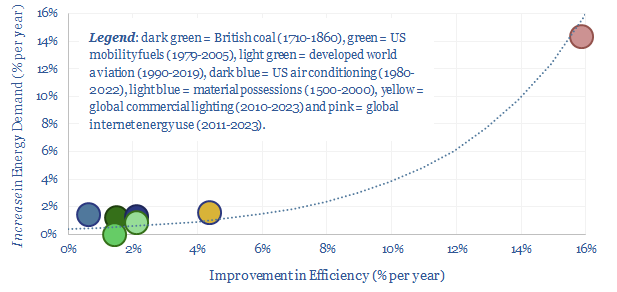
Using a commodity more efficiently can cause its demand to rise not fall; as greater efficiency opens up unforeseen possibilities. This is Jevon’s Paradox. Our 16-page report finds it is more prevalent than we expected. Efficiency gains underpin 25% of our roadmap to net zero. To be effective, commodity prices must also rise and remain…
-
Transaction prices for power generation assets?
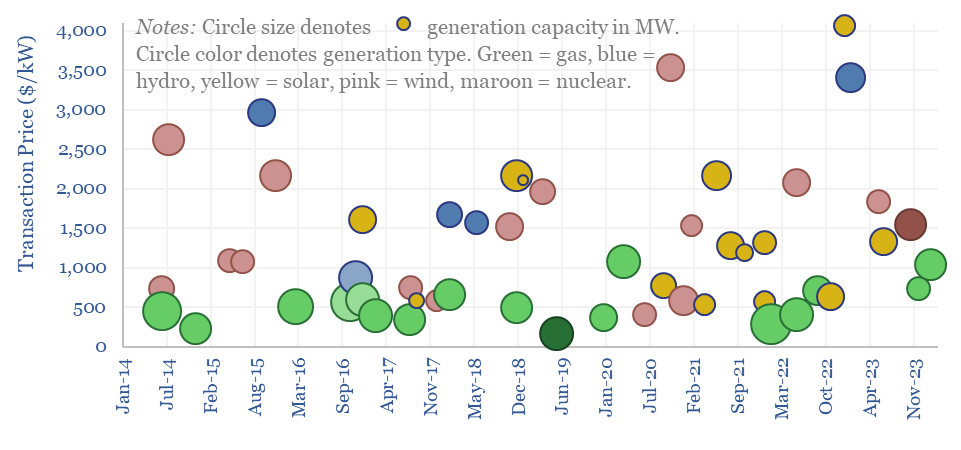
Transaction prices for power generation assets are tabulated in this data-file, capturing 65 deals for gas plants, wind, solar, hydro and nuclear, globally and over time. Median prices are c$1,000/kW, but range from $2,500 in the upper decile.
-
Market sizing: what if CO2 abatement costs are distributed like US income?
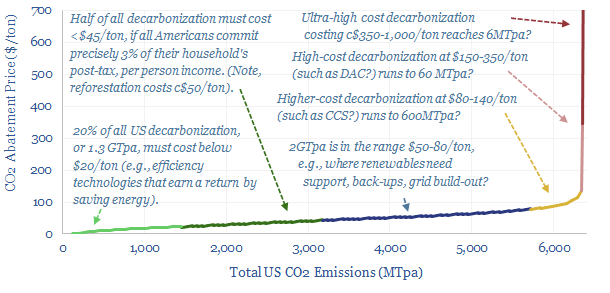
How would CO2 abatement costs end up being distributed, if they matched the distribution of US incomes? 90% of all decarbonization would have to cost less than $80/ton. There could be 600MTpa of CCS, 60MTpa of DAC, 6MTpa of green hydrogen and e-fuels?
-
Global gas prices: by country?
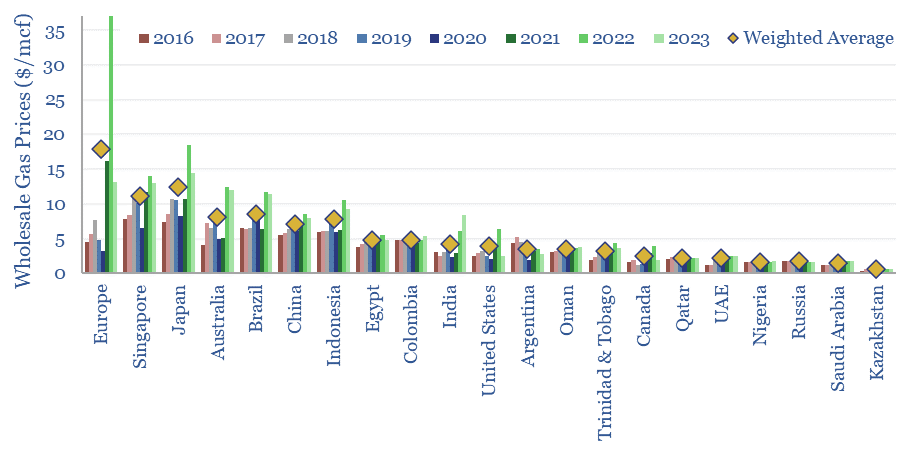
Global gas prices by country are often measured at the world-famous delivery points for liquids futures contracts, such as Henry Hub and the Netherlands’ TTF. This data-file takes a broader approach, aggregating the annual gas prices by country across twenty geographies.
Content by Category
- Batteries (89)
- Biofuels (44)
- Carbon Intensity (49)
- CCS (63)
- CO2 Removals (9)
- Coal (38)
- Company Diligence (95)
- Data Models (840)
- Decarbonization (160)
- Demand (110)
- Digital (60)
- Downstream (44)
- Economic Model (205)
- Energy Efficiency (75)
- Hydrogen (63)
- Industry Data (279)
- LNG (48)
- Materials (82)
- Metals (80)
- Midstream (43)
- Natural Gas (149)
- Nature (76)
- Nuclear (23)
- Oil (164)
- Patents (38)
- Plastics (44)
- Power Grids (130)
- Renewables (149)
- Screen (117)
- Semiconductors (32)
- Shale (51)
- Solar (68)
- Supply-Demand (45)
- Vehicles (90)
- Wind (44)
- Written Research (354)