Permian CO2 Emissions by Producer
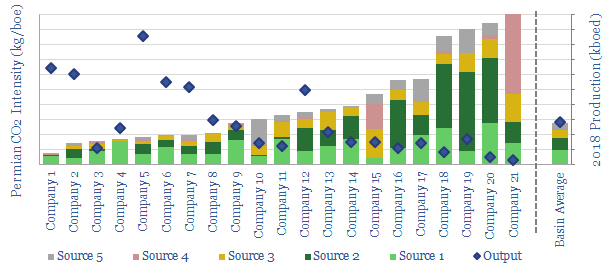
…tons and in kg/boe. The data are fully disaggregated by company, across the 20 largest Permian E&Ps, Majors and independents; and across 18 different categories, such as combustion, flaring, venting,…
the research consultancy for energy technologies
…tons and in kg/boe. The data are fully disaggregated by company, across the 20 largest Permian E&Ps, Majors and independents; and across 18 different categories, such as combustion, flaring, venting,…
…emissions per barrel, including flaring policies, refining quality, midstream proximity, proprietary gas turbine technologies from ExxonMobil’s patents and leading digital technologies around the industry. Our conclusion is that leading companies…
…the point of combustion (data here). The spread is wide, after comparing and contrasting 425 companies here and here. The best decarbonization opportunities for shale are mitigating flaring and methane…