Search results for: “lithium”
-
New energies: the age of materials?

Over the past decade, costs have deflated by 85% for lithium ion batteries, 75% for solar and 25% for onshore wind. Now new energies are entering a new era. Future costs are mainly determined by materials. Bottlenecks matter. Deflation is slower. Even higher-grade materials are needed to raise efficiency. This 14-page note explores the new…
-
Overview of inertia in renewable-heavy grids?
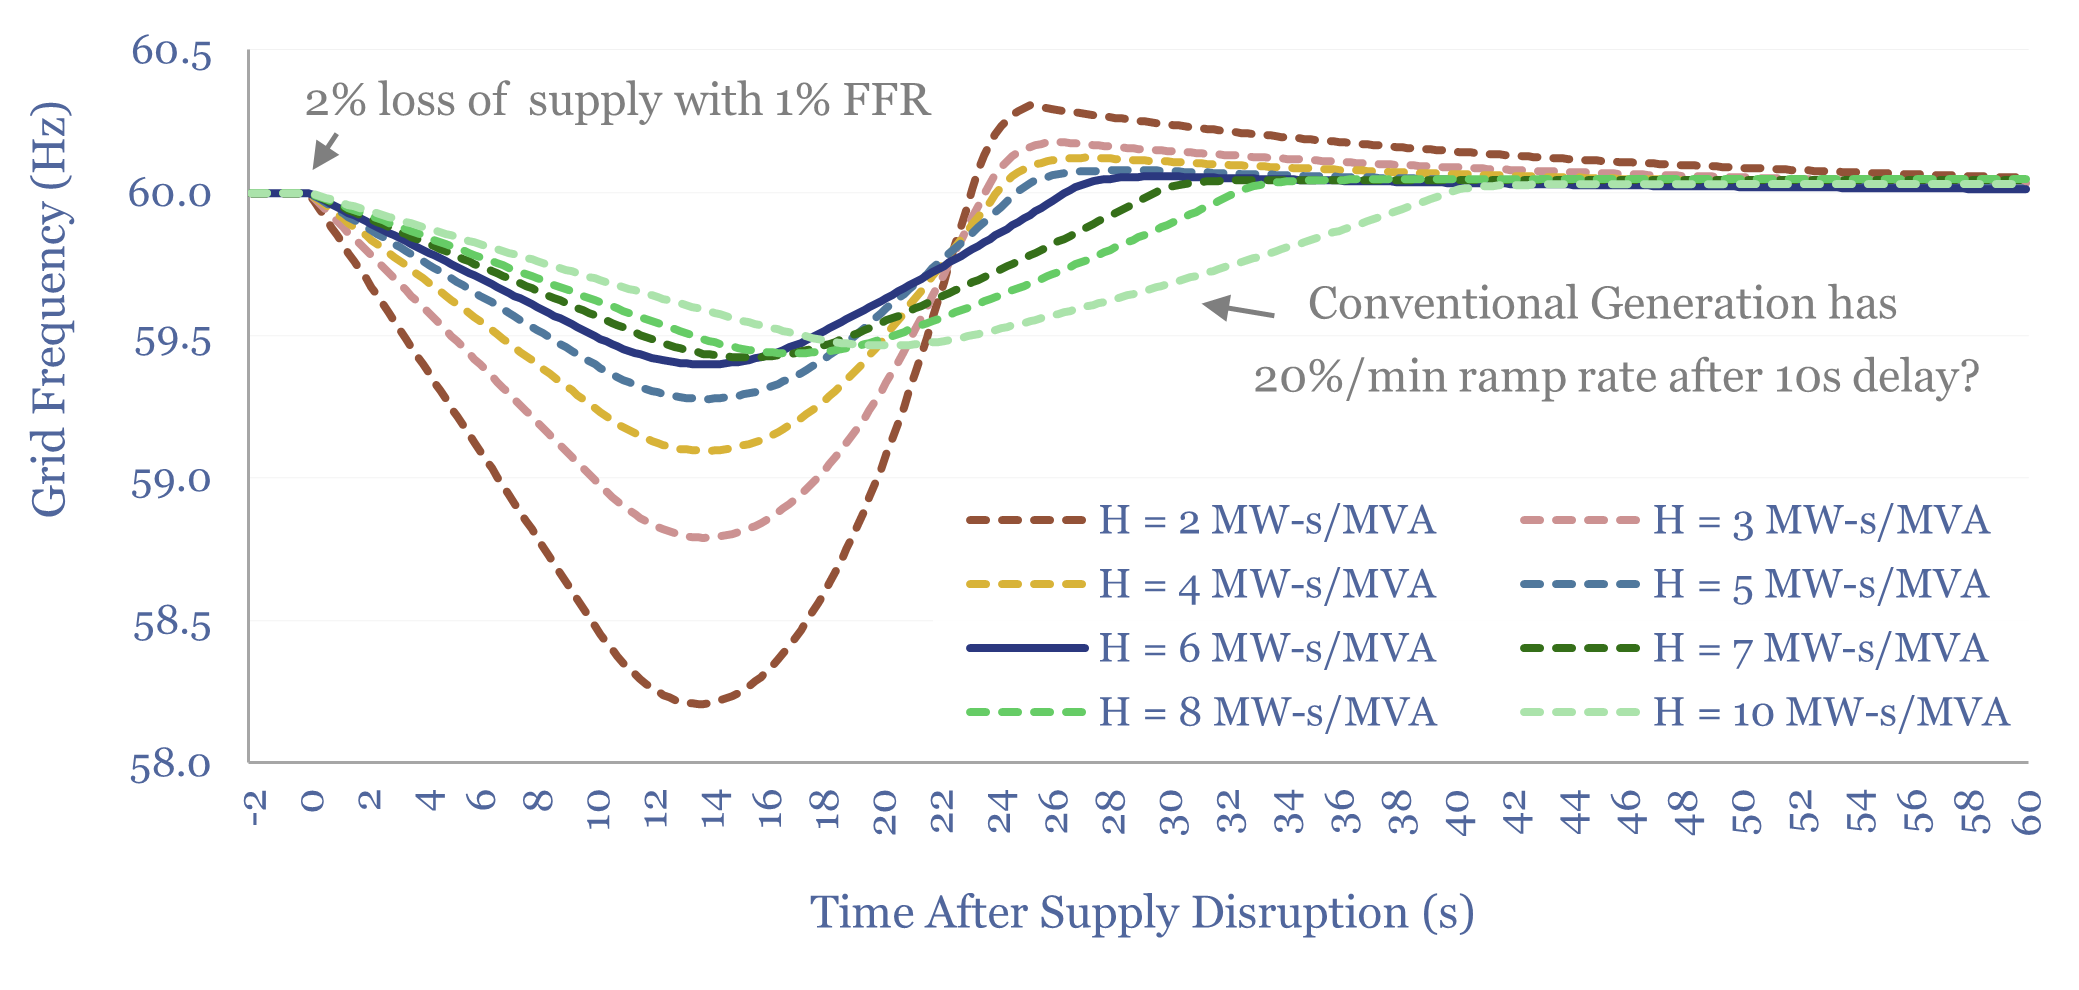
This overview of inertia in renewable-heavy grids tabulates the typical inertia of rotating generators, then models the resultant Rate of Change of Frequency (ROCOF) during supply disruptions. In our base case, a grid with 6 MW-s/MVA of inertia rides through a 2% supply-disruption, buffered by 1% fast frequency response (FFR), via lowering grid frequency from…
-
Data center energy: caps lock?
Everybody knows “AI data centers use round-the-clock power”. Yet one of the biggest power challenges for AI data data centers is precisely that they do not use round-the-clock power. They incur large load transients that cannot be handled by batteries, power grids or most generation. This 15-page report explores data center load profiles, which may…
-
Verdox: DAC technology breakthrough?
This data-file reviews Verdox DAC technology, optimizing polyanthraquinones and polynaphthoquinones, then depositing them on porous carbon nano-tube scaffolds. These quinones are shown to selectively adsorb CO2 when a voltage is applied, then desorb them when a reverse voltage is applied, unlocking 70% lower energy penalties than incumbent DAC?
-
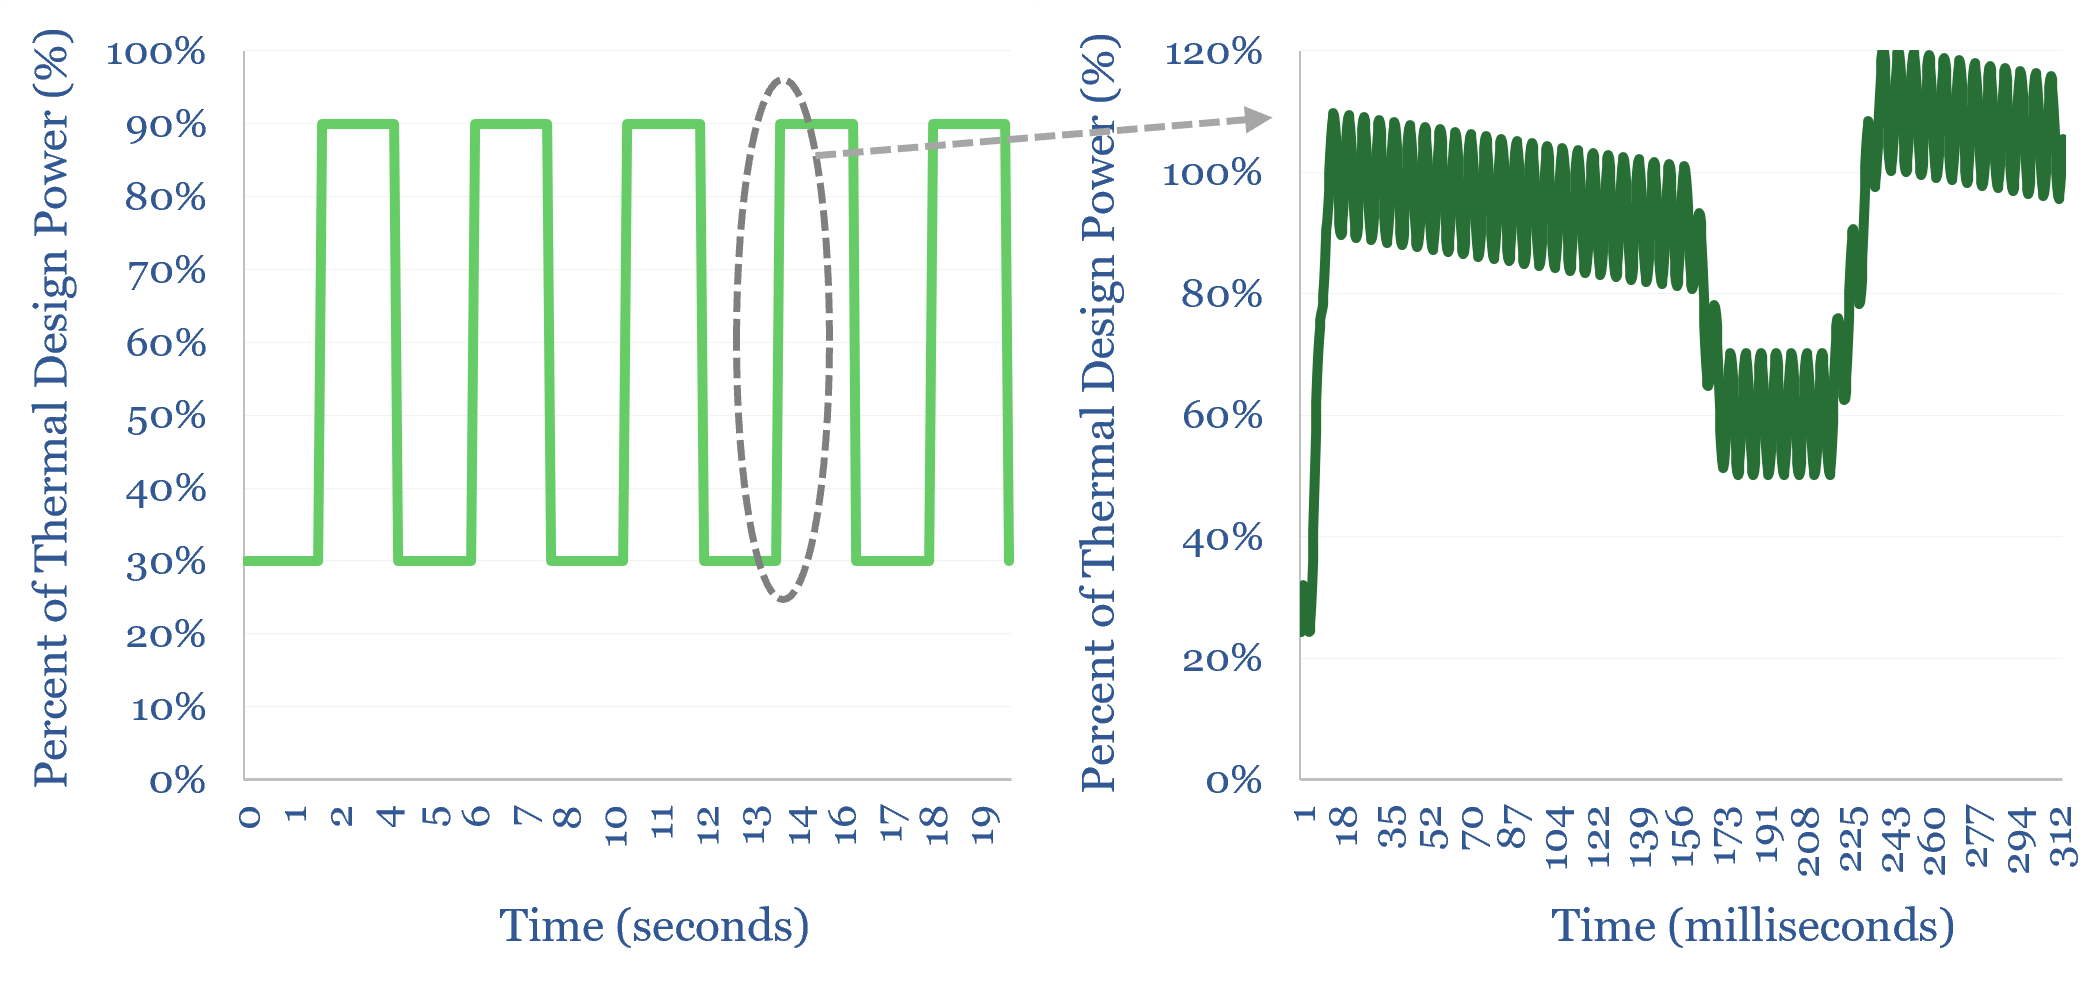
Grid-scale battery operation: a case study?
Grid-scale batteries are not simply operated to store up excess renewables and move them to non-windy and non-sunny moments, in order to increase reneawble penetration rates. Their key practical rationale is providing short-term grid stability to increasingly volatile grids that need ‘synthetic inertia’. Their key economic rationale is arbitrage. Numbers are borne out by our…
-
Pumped hydro: the economics?
This data-file assesses pumped hydro costs, to back up wind and solar. A typical project has 0.5GW of capacity, 12-hours storage duration, 80% efficiency, and capex costs of $2,250/kW. Thus it requires a 25c/kWh storage spread, in order to generate a 10% IRR.
-
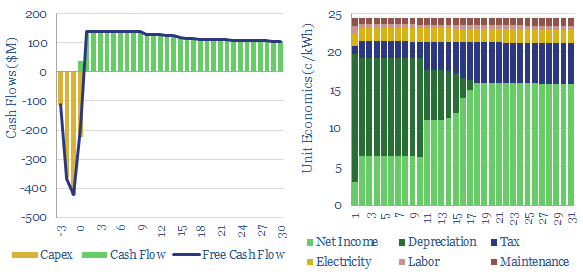
Rare Earth mining and refining: the economics?
The costs of Rare Earth mining and refining are captured in this model, requiring a $70/kg blended product price, to generate a 20% IRR on $150,000/Tpa of capex. Primary energy intensity exceeds 100 MWH/ton and CO2 intensity exceeds 20 tons/ton. Economics are particularly sensitive to ore grade, recovery rates and chemical costs.
-
Redox flow batteries: for the duration?
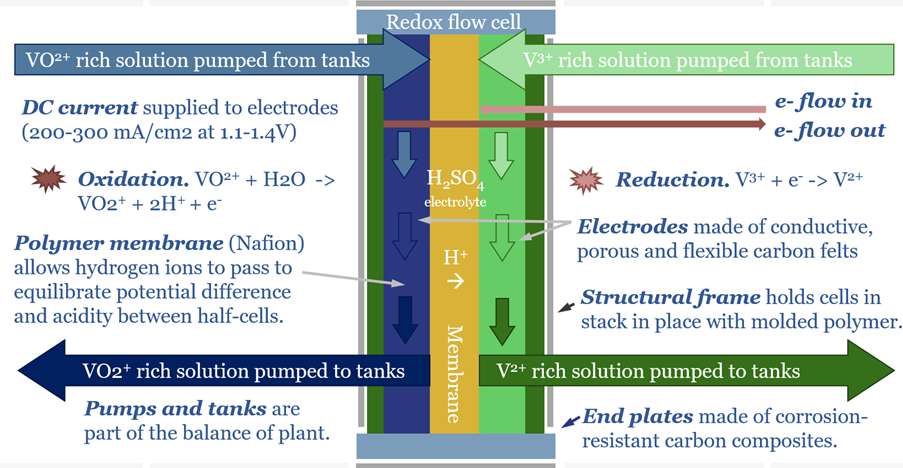
Redox flow batteries have 6-24 hour durations and require 15-20c/kWh storage spreads. They will increasingly compete with lithium ion batteries in grid-scale storage. Does this unlock a step-change for peak renewables penetration? Or create 3-30x upside for total global Vanadium demand? This 15-page note is our outlook for redox flow batteries.
-
Capital goods market sizes: by category, by country?
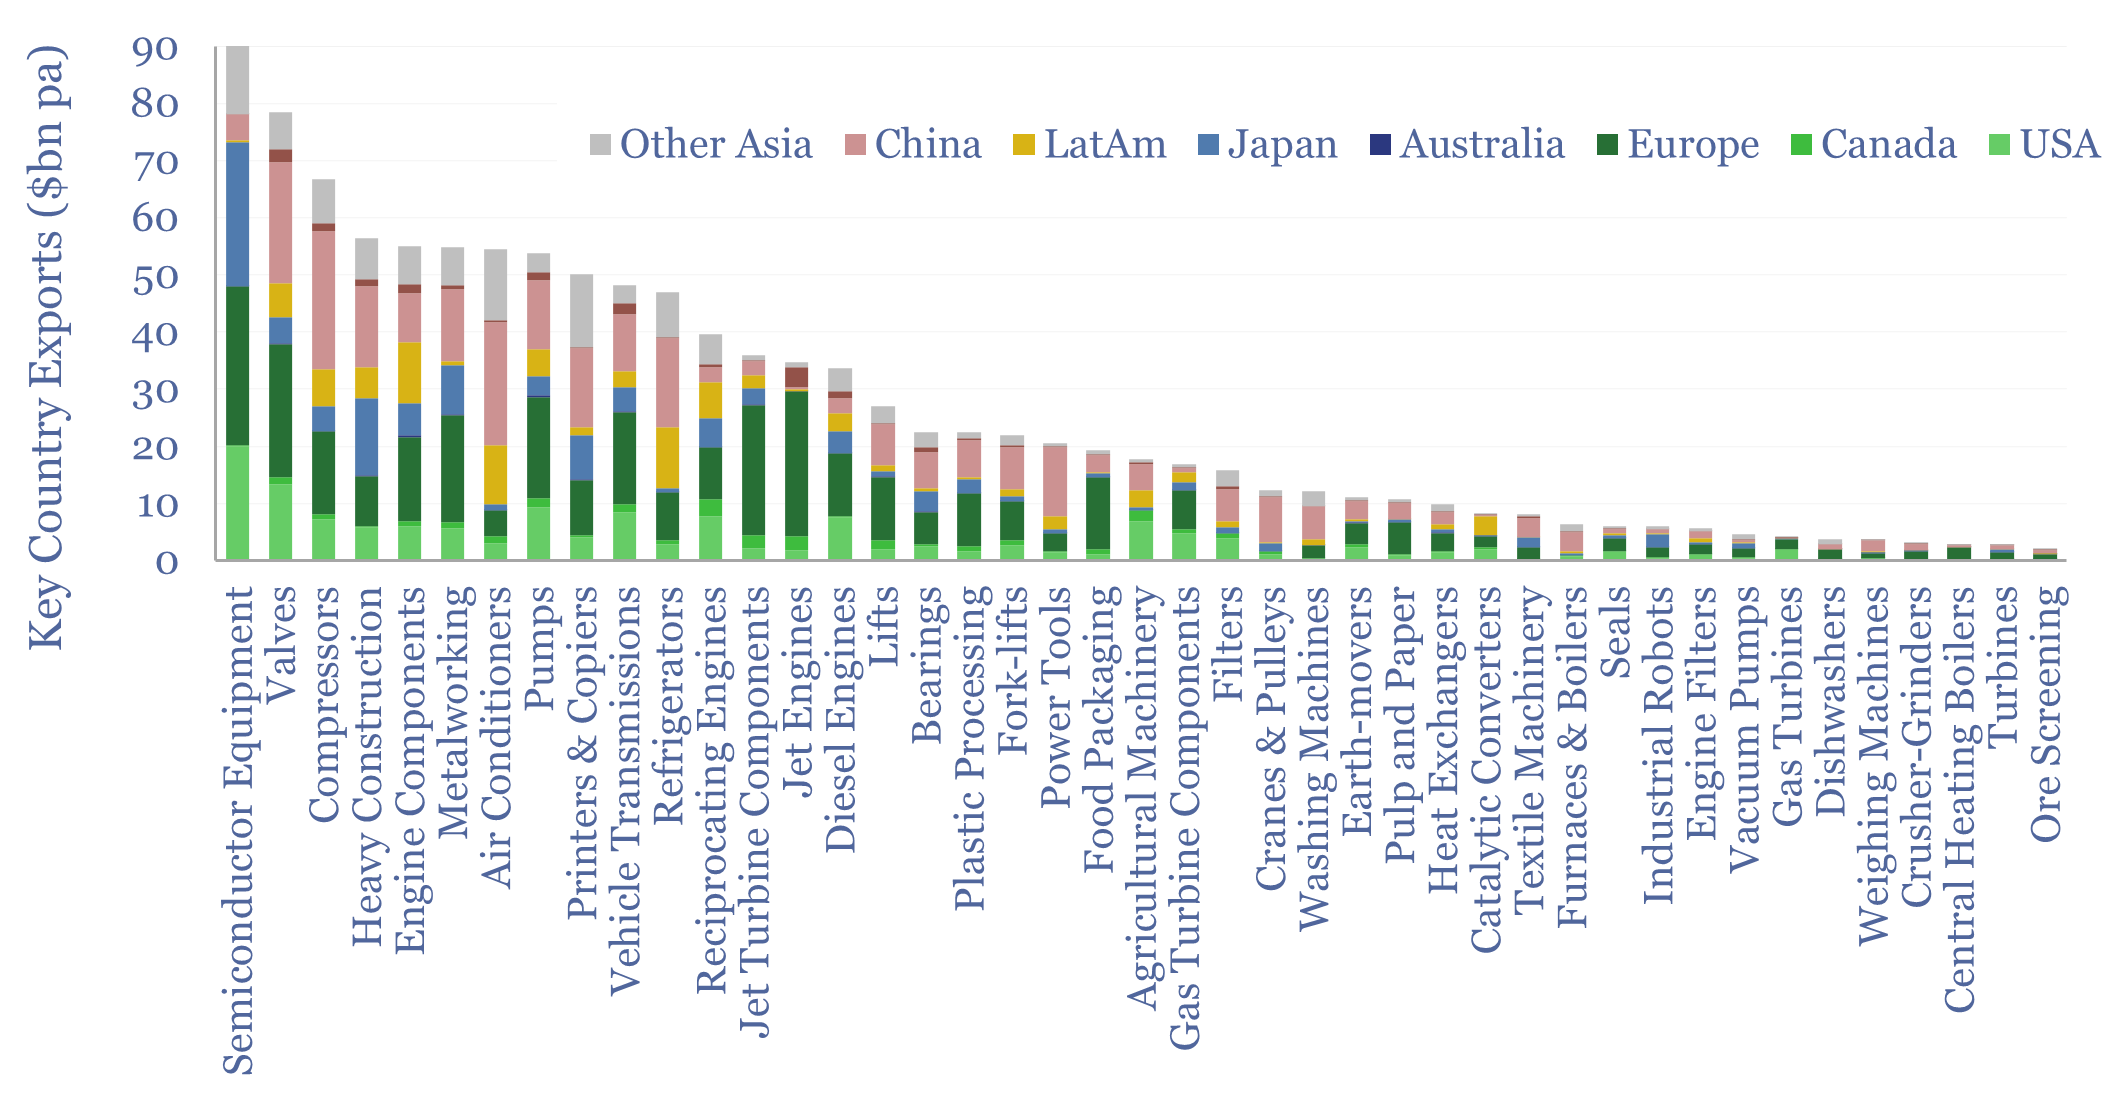
This data-file tabulates globally traded capital goods market sizes, based on the values of products exported from different countries-regions. Specifically, commodity Code 84 represents machinery and mechanical appliances, worth $2.5trn pa in 2023. About half of that represents classic capital goods categories, as decomposed in the chart above. Our top five conclusions follow below.
-
Market concentration by industry in the energy transition?
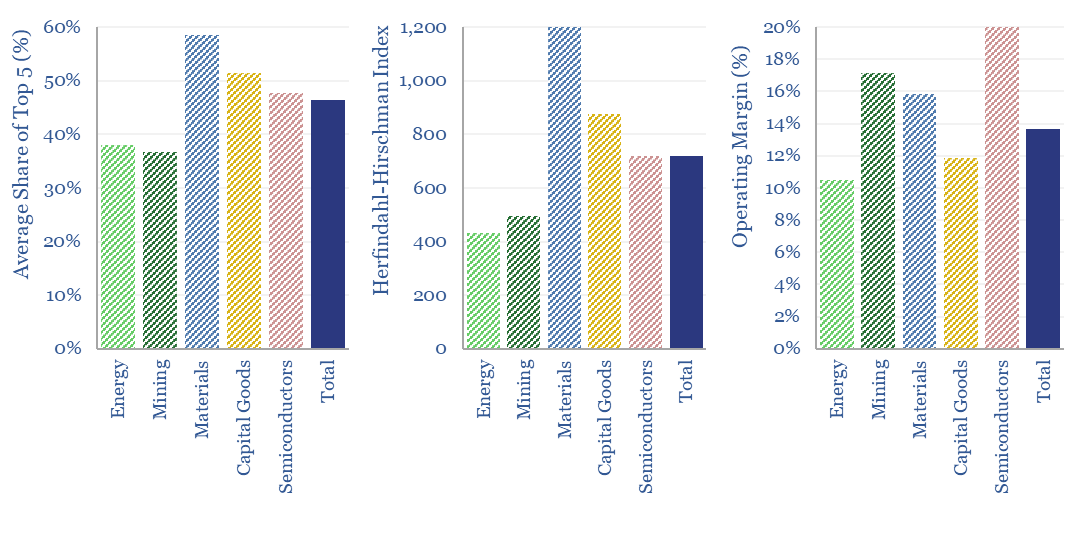
What is the market concentration by industry in energy, mining, materials, semiconductors, capital goods and other sectors that matter in the energy transition? The top five firms tend to control 45% of their respective markets, yielding a ‘Herfindahl Hirschman Index’ (HHI) of 700.
Content by Category
- Batteries (89)
- Biofuels (44)
- Carbon Intensity (49)
- CCS (63)
- CO2 Removals (9)
- Coal (38)
- Company Diligence (94)
- Data Models (838)
- Decarbonization (160)
- Demand (110)
- Digital (59)
- Downstream (44)
- Economic Model (204)
- Energy Efficiency (75)
- Hydrogen (63)
- Industry Data (279)
- LNG (48)
- Materials (82)
- Metals (80)
- Midstream (43)
- Natural Gas (148)
- Nature (76)
- Nuclear (23)
- Oil (164)
- Patents (38)
- Plastics (44)
- Power Grids (130)
- Renewables (149)
- Screen (117)
- Semiconductors (32)
- Shale (51)
- Solar (68)
- Supply-Demand (45)
- Vehicles (90)
- Wind (44)
- Written Research (354)