Search results for: “LNG”
-
Gas diffusion: how will record prices resolve?
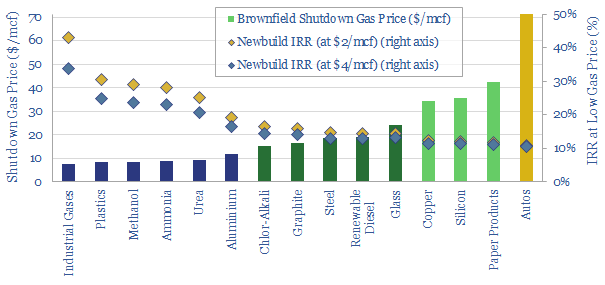
Dispersion in global gas prices has hit new highs in 2022. Hence this 17-page note evaluates two possible solutions. Building more LNG plants achieves 15-20% IRRs. But shuttering some of Europe’s gas-consuming industry then re-locating it in gas-rich countries can achieve 20-40% IRRs, lower net CO2 and lower risk? Both solutions should step up. What…
-
Methane slip: how much gas evades combustion?
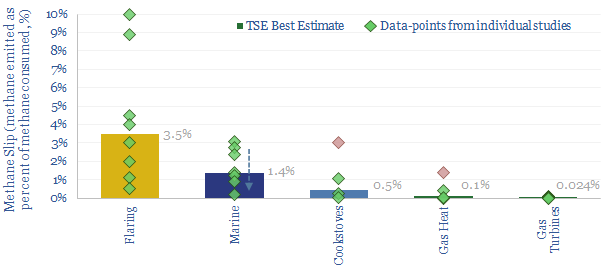
Methane slip occurs when a small portion of natural gas fails to combust, and instead escapes into the atmosphere. This data-file reviews different technical papers. Methane slip is effectively nil at gas turbines and gas heating (less than 0.1%). It rises to 0.5-3% in cookstoves and some dual-fuel marine engines. However, the highest rate of…
-
Sabatier process: synthetic natural gas costs?
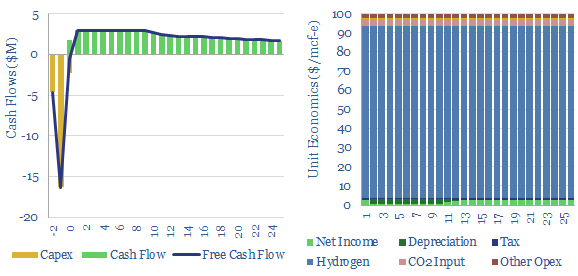
The Sabatier process combines CO2 and hydrogen to yield synthetic natural gas using a nickel catalyst at 300-400C. A gas price of $100/mcf is needed for a 10% IRR, energy penalties exceed 75% and CO2 abatement cost is $2,000/ton?
-
Market concentration by industry in the energy transition?
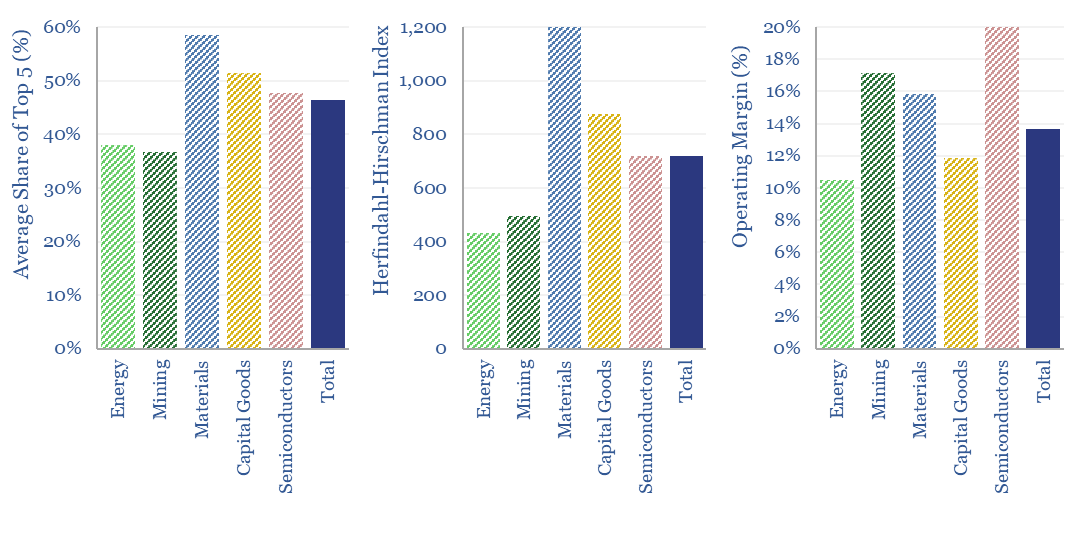
What is the market concentration by industry in energy, mining, materials, semiconductors, capital goods and other sectors that matter in the energy transition? The top five firms tend to control 45% of their respective markets, yielding a ‘Herfindahl Hirschman Index’ (HHI) of 700.
-
Energy trading: value in volatility?
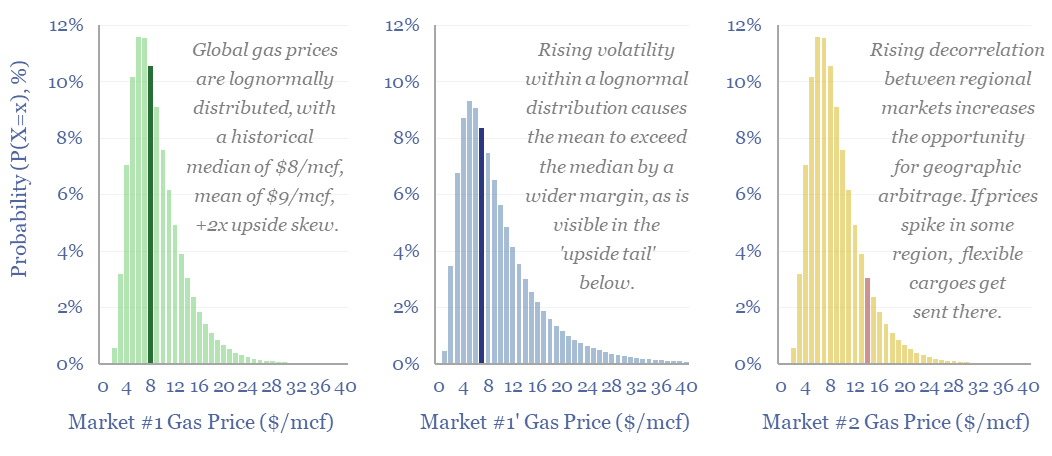
Could renewables increase hydrocarbon realizations? Or possibly even double the value in flexible LNG portfolios? Our reasoning in this 14-page report includes rising regional arbitrages, and growing volatility amidst lognormal price distributions (i.e., prices deviate more to the upside than the downside). What implications and who benefits?
-
Engineering and construction companies screen?
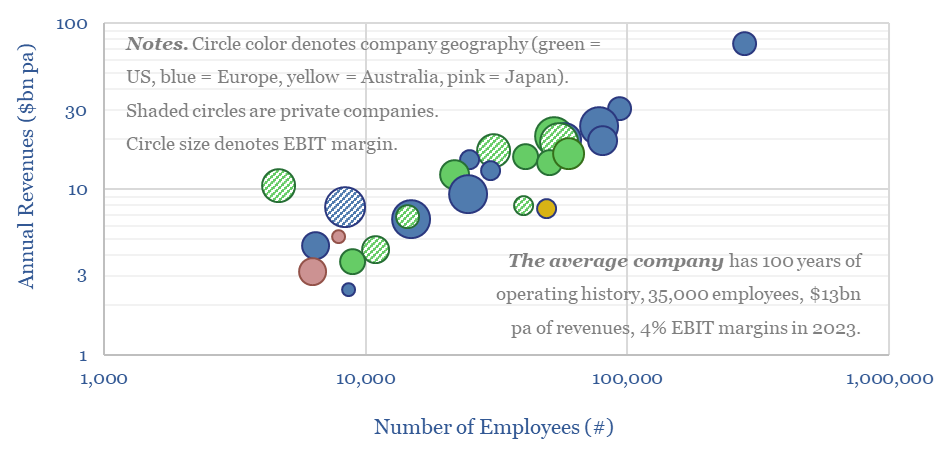
40% of total installed project costs tend to accrue to construction companies, as screened in this data-file. The average of 25 large engineering and construction companies has 100 years of operating history, 35,000 employees, generated $13bn pa of revenues in 2023, and at a c4% EBIT margins.
-
Japan gas and power: supply-demand model?
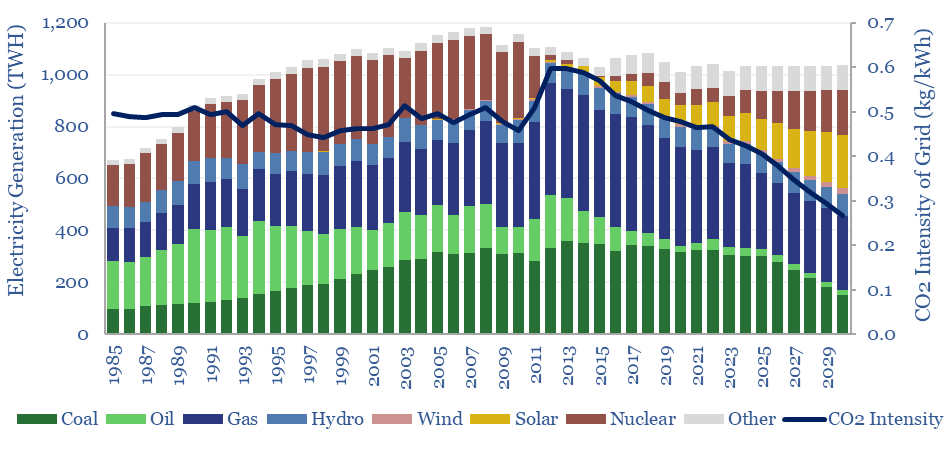
Japan’s gas and power markets are broken down by end use, traced back to 1990, and forecast forwards to 2030 in this model. Japan’s electricity demand now grows at 0.3% pa. Ramping renewables, nuclear and gas back-ups could halve Japan’s total grid CO2 intensity to below 0.25 kg/kWh by 2030.
-
Global gas turbines by region and over time?
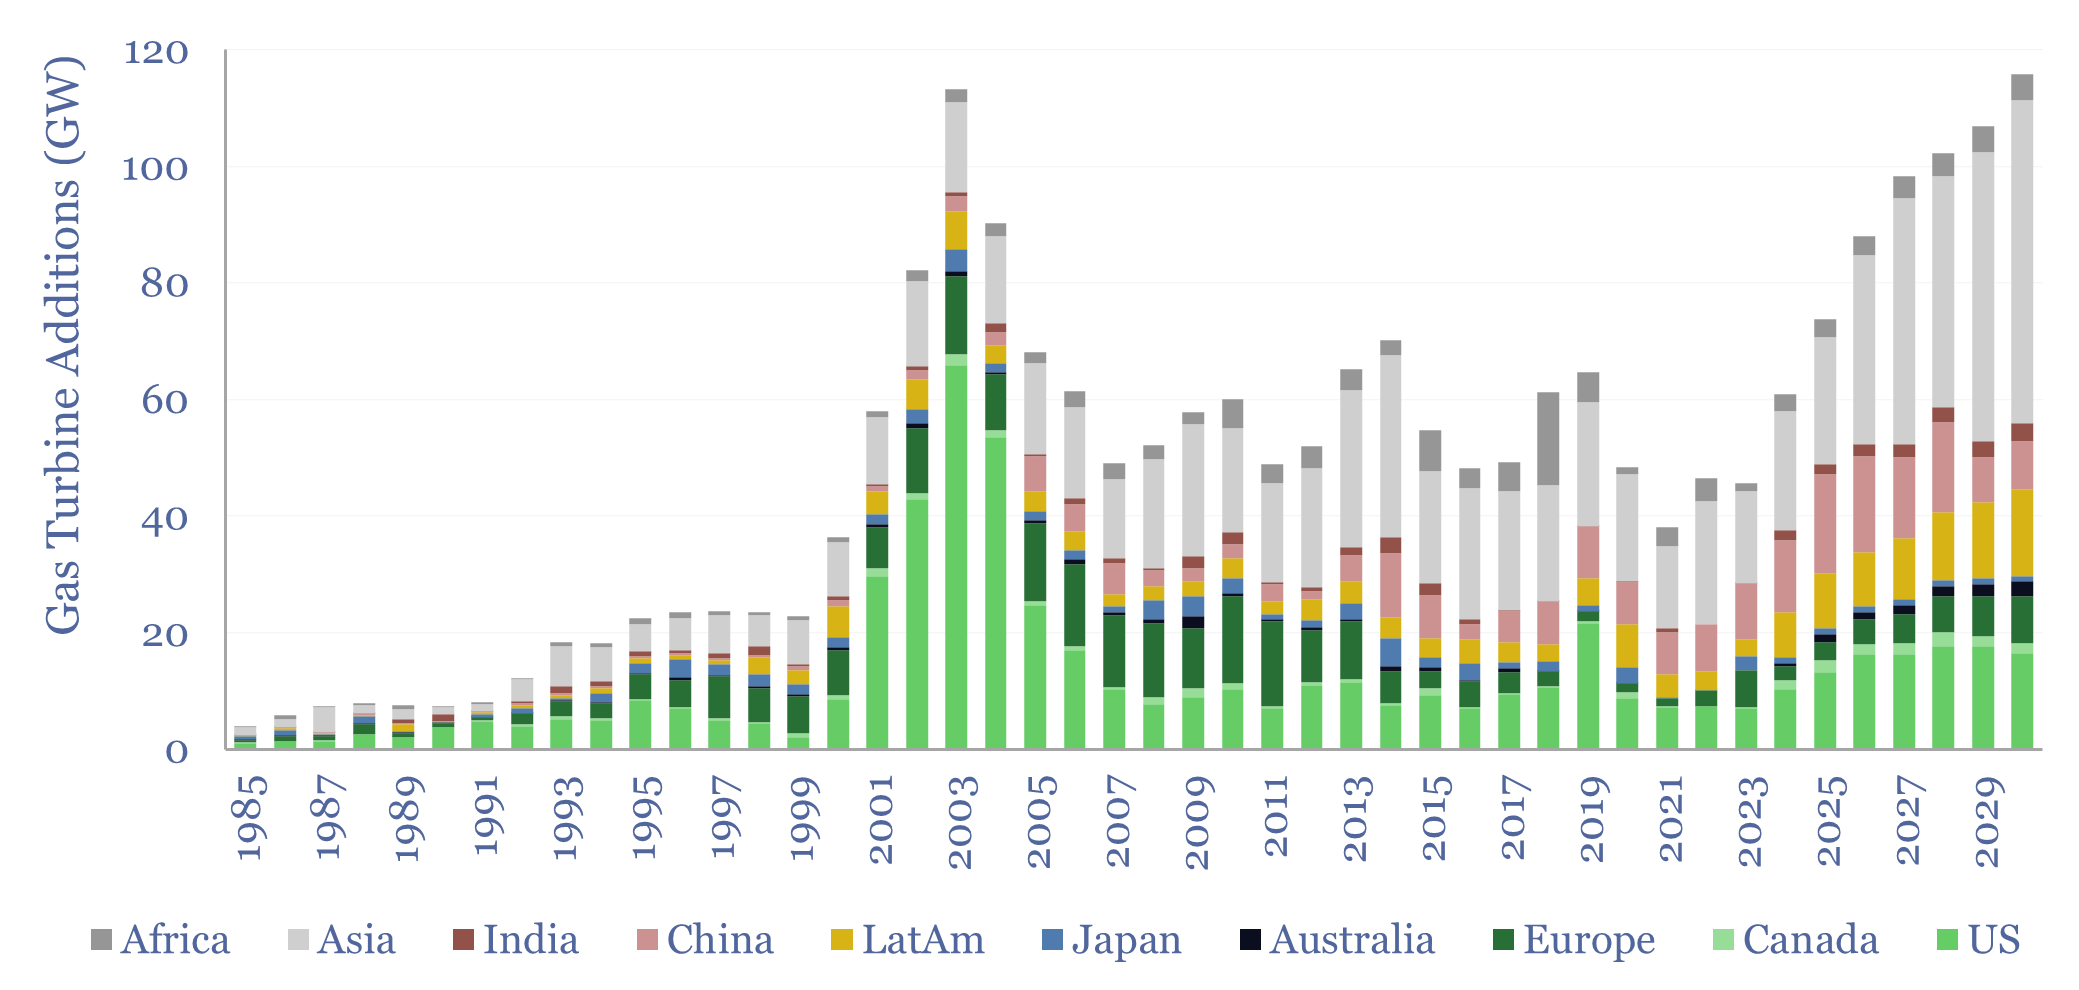
Global gas turbine additions averaged 50 GW pa over the decade from 2015-2024, of which the US was 20%, Europe was 10%, Asia was 50%, LatAm was 10% and Africa was 10%. Yet global gas turbine additions could double to 100 GW pa in 2025-30. This data-file estimates global gas turbine capacity by region and…
-
Australia energy supply-demand model?
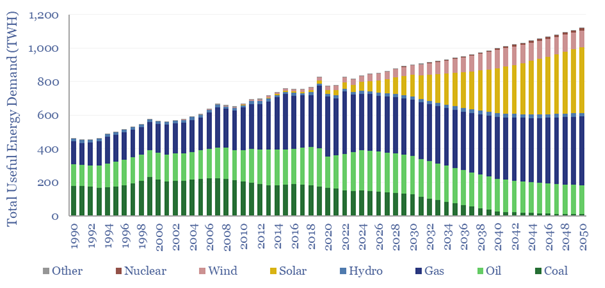
Australia’s useful energy consumption rises from 820TWH pa in 2023, by 1.2% pa 1,100 TWH pa in 2050. As a world-leader in renewables, it makes for an interesting case study. This Australia energy supply-demand model is disaggreated across 215 line items, broken down by source, by use, from 1990 to 2023, and with our forecasts…
-
Maintenance costs for gas-powered trucks?
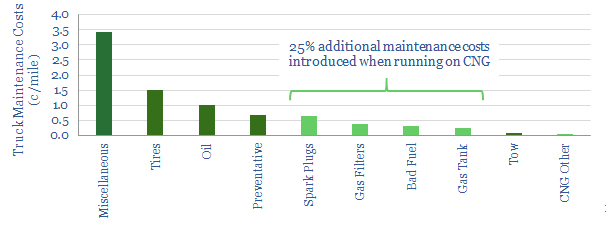
Maintenance costs are tabulated by category, for a fleet of compressed natural gas (CNG) trucks, travelling 16M miles across the United States.
Content by Category
- Batteries (88)
- Biofuels (44)
- Carbon Intensity (49)
- CCS (63)
- CO2 Removals (9)
- Coal (38)
- Company Diligence (93)
- Data Models (831)
- Decarbonization (159)
- Demand (110)
- Digital (58)
- Downstream (44)
- Economic Model (203)
- Energy Efficiency (75)
- Hydrogen (63)
- Industry Data (278)
- LNG (48)
- Materials (82)
- Metals (77)
- Midstream (43)
- Natural Gas (148)
- Nature (76)
- Nuclear (23)
- Oil (164)
- Patents (38)
- Plastics (44)
- Power Grids (127)
- Renewables (149)
- Screen (114)
- Semiconductors (30)
- Shale (51)
- Solar (67)
- Supply-Demand (45)
- Vehicles (90)
- Wind (43)
- Written Research (351)