Search results for: “climate model”
-
Ethylene vinyl acetate: production costs?
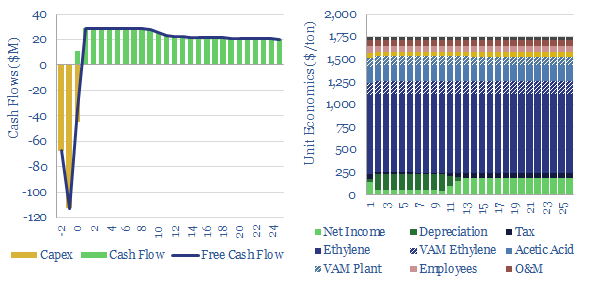
Ethylene vinyl acetate is produced by reacting ethylene with vinyl acetate monomer. This data-file estimates production costs, with a marginal cost between $1,500-2,000/ton, and a total embedded CO2 intensity of 3.0 tons/ton. EVA comprises 5% of the mass of a solar panel and could be an important solar bottleneck.
-
NET Power: gas-fired power with inherent CO2 capture?
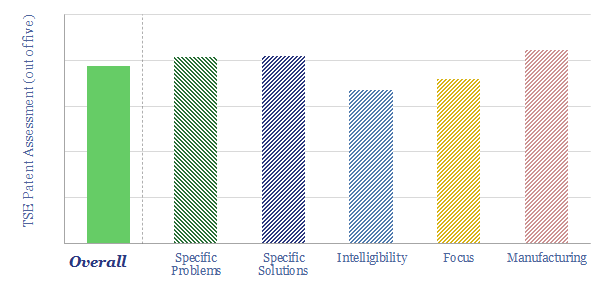
Our NET Power technology review shows over ten years of progress, refining the design of efficient power generation cycles using CO2 as the working fluid. The patents show a moat around several aspects of the technology. And six challenges at varying stages of de-risking.
-
Tree seedlings: costs and economics?
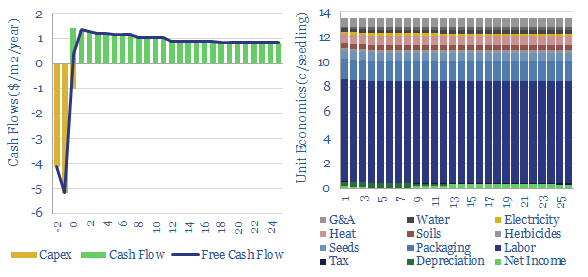
The US plants over 1.3bn tree seedlings per year. Especially pine. These seedlings are typically 8-10 months old, with heights of 25-30mm, root collars of 5mm, and total mass of 5-10 grams, having been grown by dedicated producers. This data-file captures the costs of tree seedlings, to support afforestation, reforestation or broader forestry.
-
Verbio: bio-energy technology review?
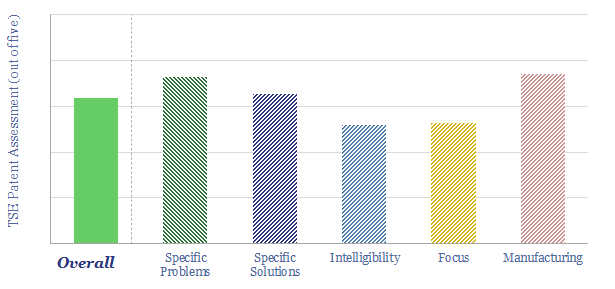
Verbio is a bio-energy company, founded in 2006, listed in Germany, producing bio-diesel, bioethanol, biogas, glycerin and fertilizers. The company has stated “we want to be in a position to convert anything that agriculture can deliver to energy”. Our Verbio technology review is based on its patents. We find some fascinating innovations in cold mash…
-
Gas turbines: operating parameters?
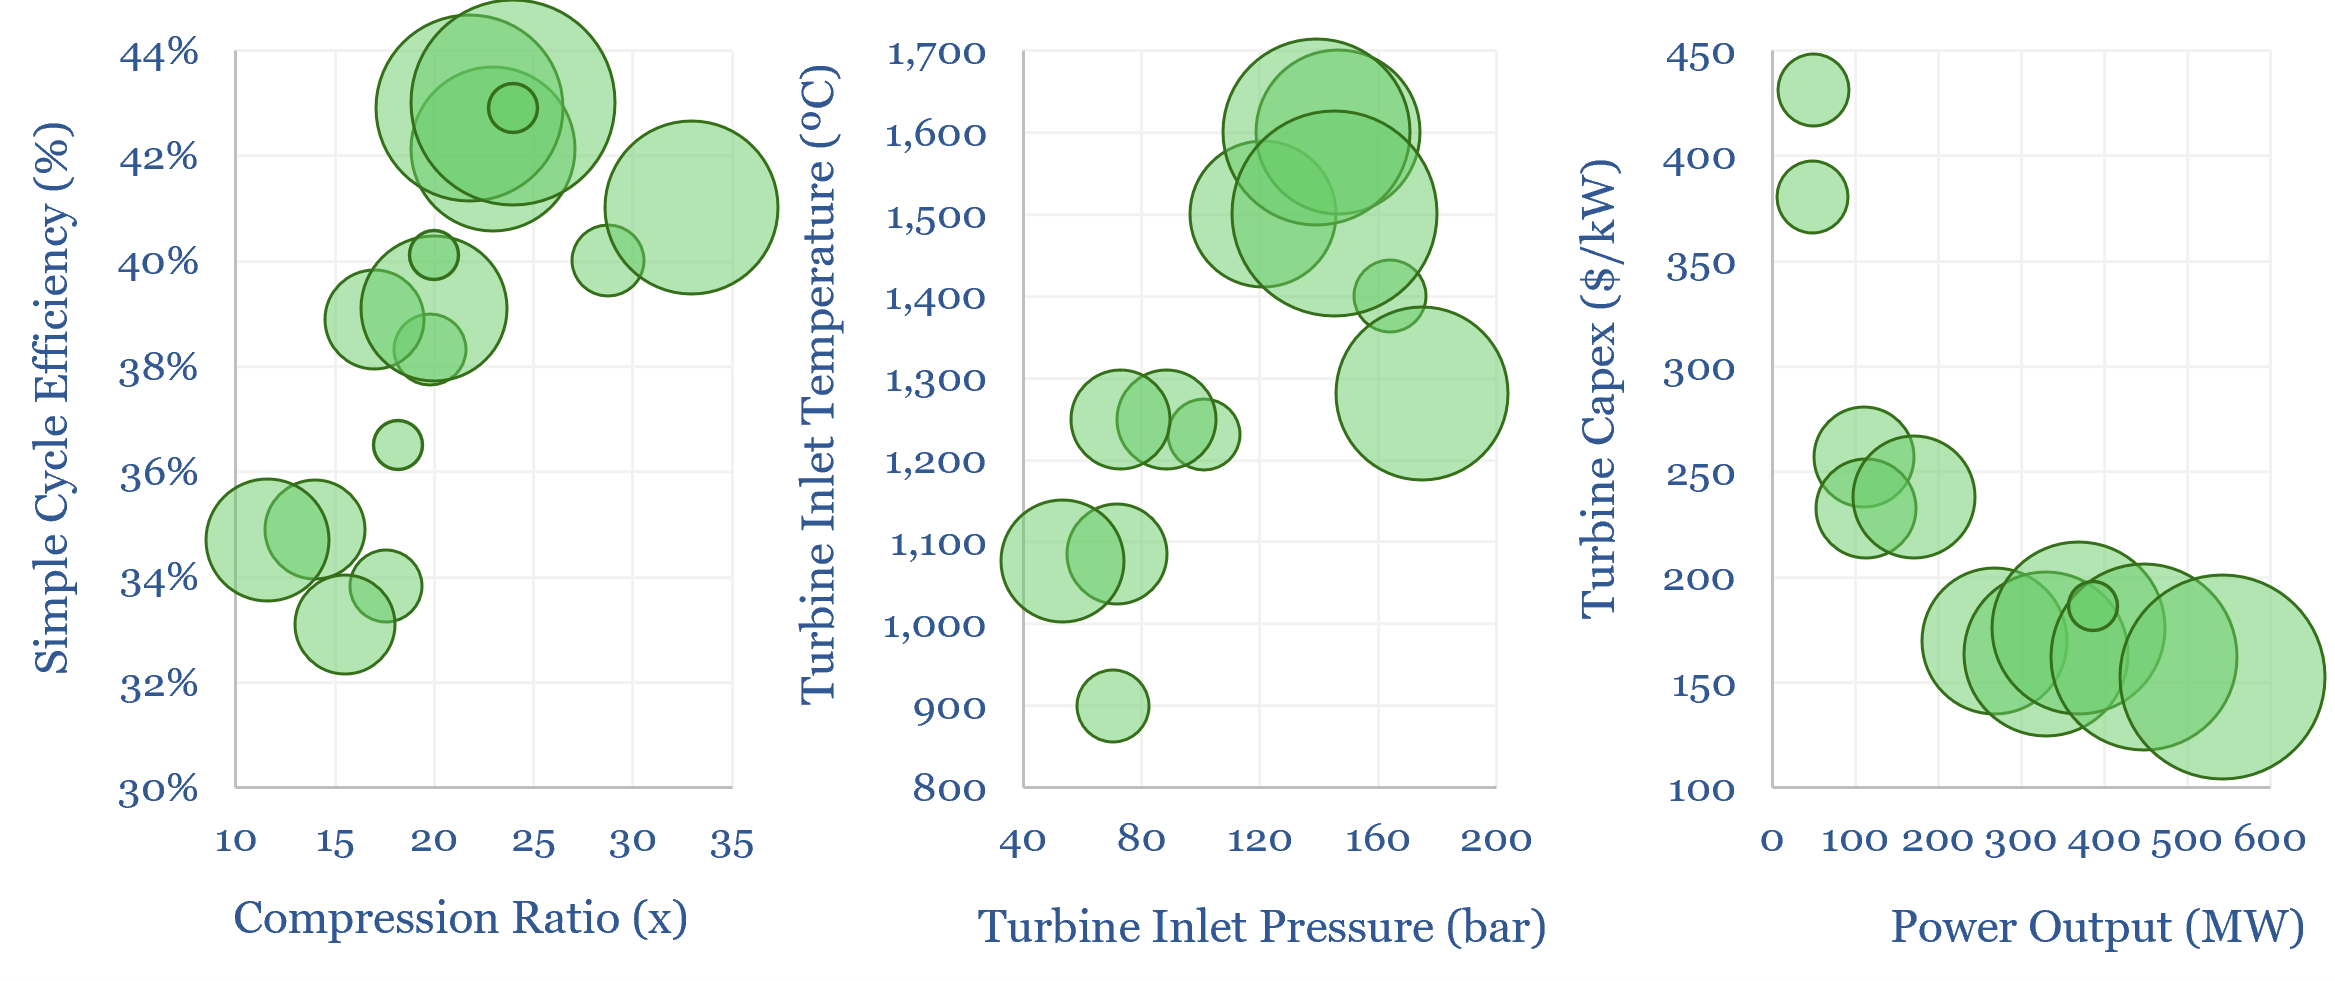
A typical simple-cycle gas turbine is sized at 200MW, and achieves 38% efficiency, as super-heated gases at 1,250ºC temperature and 100-bar pressure expand to drive a turbine. The exhaust gas is still at about 600ºC. In a combined cycle gas plant, this heat can be used to produce steam that drives an additional turbine, adding…
-
Flaring reduction: screen of service and equipment companies?
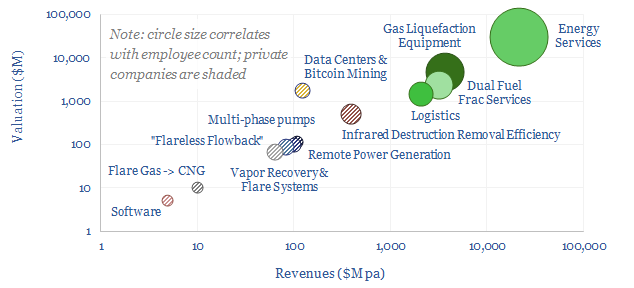
This data-file is a screen of companies that can reduce routine flaring and reduce the ESG impacts of unavoidable residual flaring. The landscape is broad, ranging from large, listed and diversified oil service companies with $30bn market cap to small private analytics companies with
-
DC-DC power converters: efficiency calculations?
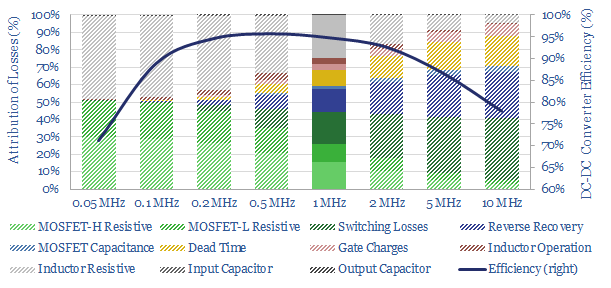
DC-DC power converters are used to alter the voltage in DC circuits, such as in wind turbines, solar MPPT, batteries and digital/computing devices. This data-file is a breakdown of DC-DC power converters’ electrical efficiency, which will typically be around 95%. Losses are higher at low loads. We think there will be upside for increasingly high-quality…
-
Sabatier process: synthetic natural gas costs?
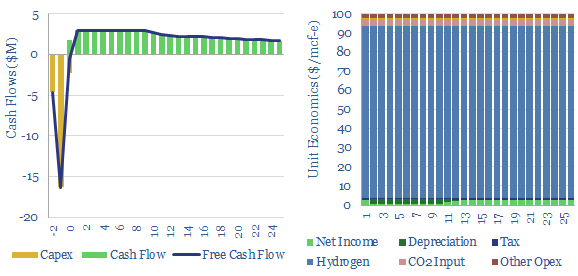
The Sabatier process combines CO2 and hydrogen to yield synthetic natural gas using a nickel catalyst at 300-400C. A gas price of $100/mcf is needed for a 10% IRR, energy penalties exceed 75% and CO2 abatement cost is $2,000/ton?
-
Membrane Technology and Research: CCS breakthrough?
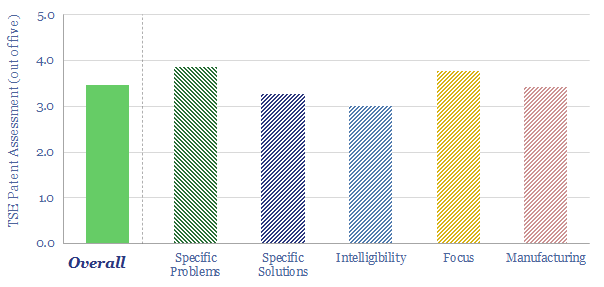
Membrane Technology and Research Inc. (MTR) is a private company, specializing in membrane separations, for the energy industry, chemicals and increasingly, CCS. Its Gen 2-3 Polaris membranes have 50x CO2:N2 selectivity, 2,000-3,000 GPU permeabilities, and are at TRL 6-7. Is there a moat?
Content by Category
- Batteries (89)
- Biofuels (44)
- Carbon Intensity (49)
- CCS (63)
- CO2 Removals (9)
- Coal (38)
- Company Diligence (94)
- Data Models (838)
- Decarbonization (160)
- Demand (110)
- Digital (59)
- Downstream (44)
- Economic Model (204)
- Energy Efficiency (75)
- Hydrogen (63)
- Industry Data (279)
- LNG (48)
- Materials (82)
- Metals (80)
- Midstream (43)
- Natural Gas (148)
- Nature (76)
- Nuclear (23)
- Oil (164)
- Patents (38)
- Plastics (44)
- Power Grids (130)
- Renewables (149)
- Screen (117)
- Semiconductors (32)
- Shale (51)
- Solar (68)
- Supply-Demand (45)
- Vehicles (90)
- Wind (44)
- Written Research (354)
