Search results for: “companies”
-
Cool customers: AI data-centers and industrial HVAC?
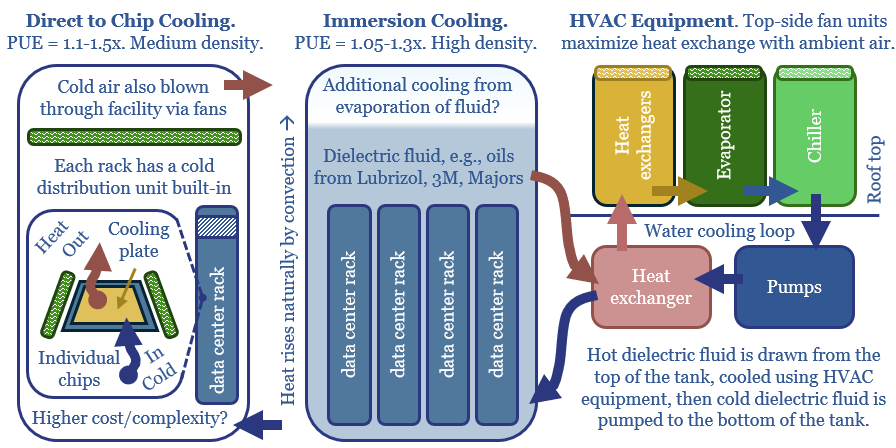
Chips must usually be kept below 27ºC, hence 10-20% of both the capex and energy consumption of a typical data-center is cooling, as explored in this 14-page report. How much does climate matter? What changes lie ahead? And which companies sell into this soon-to-double market for cooling equipment?
-
Road costs: economic model?
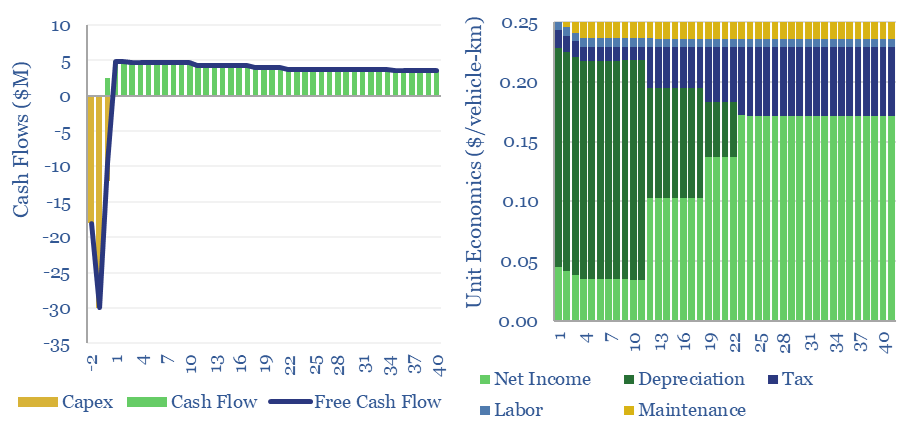
A typical road costs $3M/lane-km to construct, with an effective cost of $0.25 per vehicle-km subsequently travelled. The range varies with utilization and road complexity. Around 10% of the costs are materials, mainly aggregates, while the remainder of the capex is spent on construction and engineering.
-
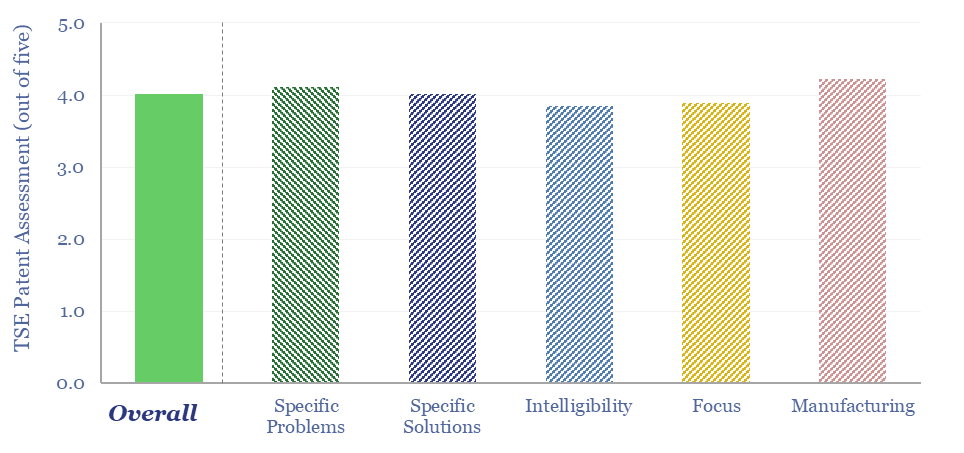
Mainspring Energy: linear generator breakthrough?
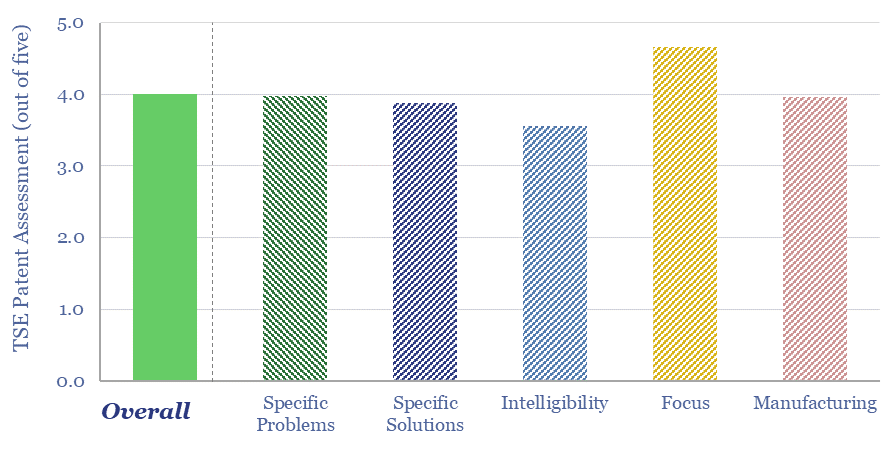
Linear generator technology can convert any gaseous fuel into electricity, with c45% electrical efficiency, and >80% efficiency in CHP mode. This data-file reviews Mainspring Energy’s patents. We conclude that the company has locked up the IP for piston-seal assemblies in a linear generator with air bearings, but longevity/maintenance could be a key challenge to explore.
-
Building energy infrastructure: constructive margin?
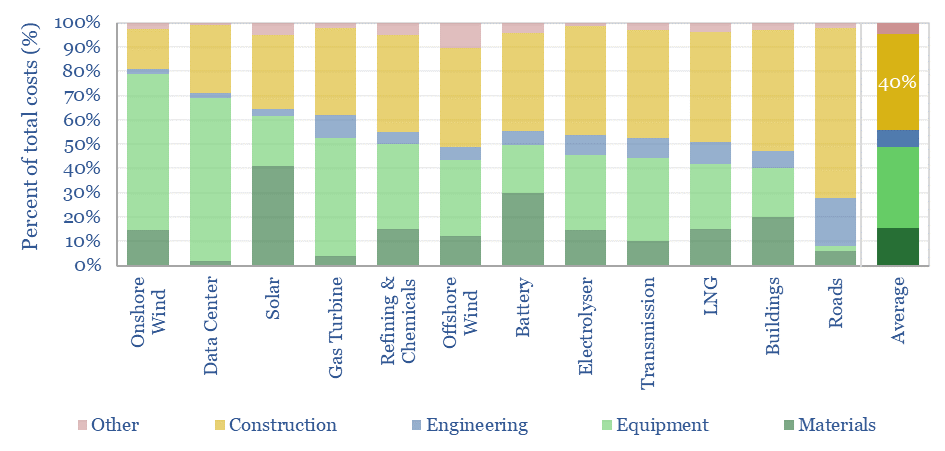
Energy transition is the largest construction project in history, with capex costs ultimately ramping up to $9trn per year. Overall, 40% of capex costs accrue to construction firms. Hence this 10-page note evaluates world-scale construction companies, their EBIT margin drivers, and who benefits from expanding power grids?
-
Global biogas production by country?
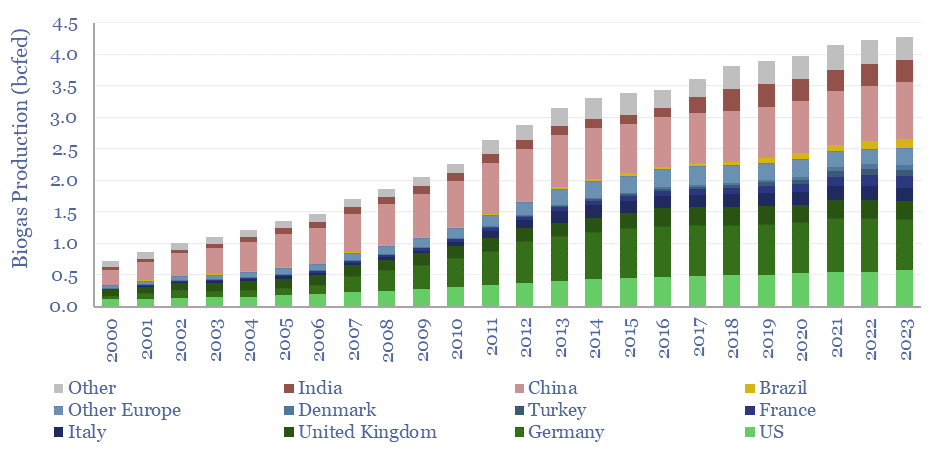
Global biogas production has risen at a 10-year CAGR of 3% to reach 4.3bcfed in 2023, equivalent to 1.1% of global gas consumption. Europe accounts for half of global biogas, helped by $4-40/mcfe subsidies. This data-file aggregates global biogas production by country, plus notes into feedstock sources, uses of biogas and biomethane.
-
Global vehicle sales by manufacturer?
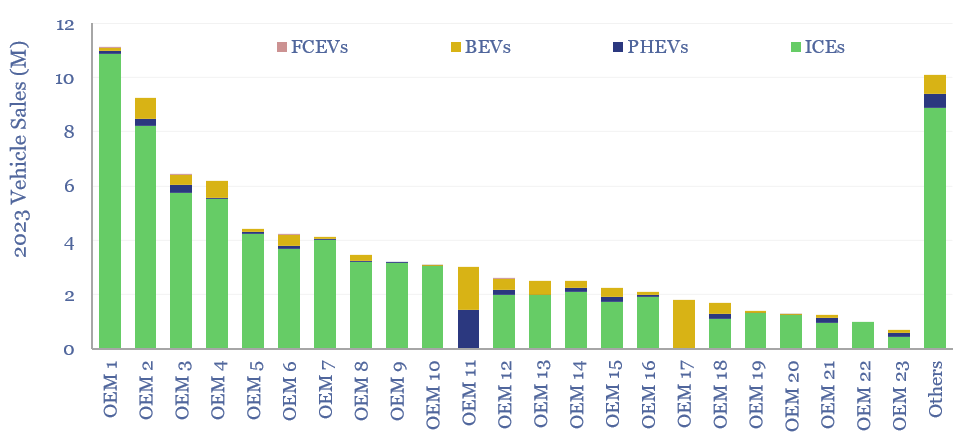
Global vehicle sales by manufacturer are broken down in this screen. 20 companies produce 85% of the world’s vehicles, led by Toyota, VW, Stellantis, GM and Ford. The data-file contains key numbers and notes on each company, including each company’s sales of BEVs, PHEVs, general EV strategy, and how it has been evolving in 2024.
-
Global uranium supply-demand?
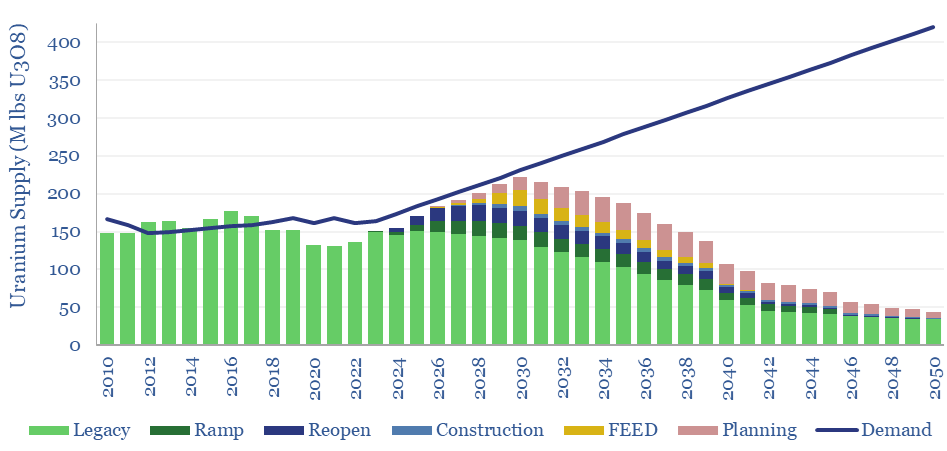
Our global uranium supply-demand model sees the market 5% under-supplied through 2030, including 7% market deficits at peak in 2025, as demand ramps from 165M lbs pa to 230M lbs pa in 2030. This is even after generous risking and no room for disruptions. What implications for broader power markets, decarbonization ambitions, and uranium prices?
-
Howmet: turbine blade breakthroughs?
Howmet is an engineered metals company, and the world’s #1 supplier of blades and vanes for jet engines and gas turbines. It has claimed an edge in direct-casting cooling channels (rather than drilling them) and bond coats that improve the adherence of Thermal Barrier Coatings. Our Howmet gas turbine technology review found support for these…
-
Uranium enrichment: by country, by company, by facility?
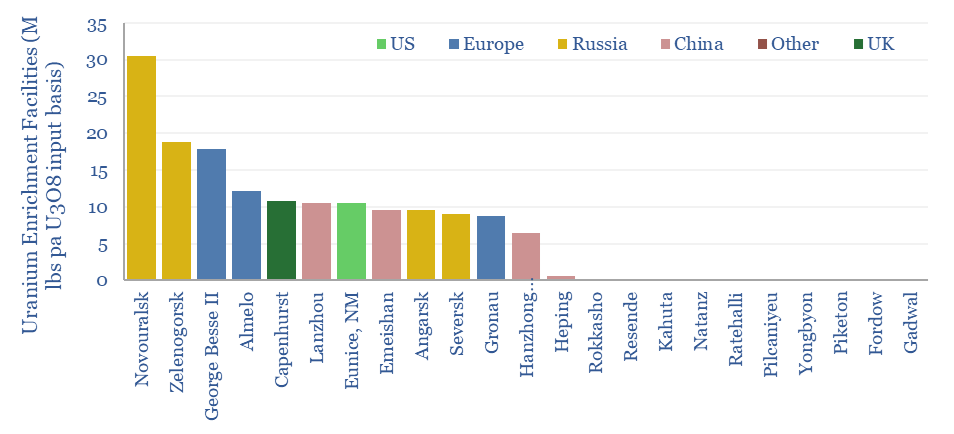
Global uranium enrichment by country, by company and by facility are estimated in this data-file, covering the 155M lbs pa uranium market. The data-file includes a build-up of enrichment facilities (ranked by SWU capacity), notes on each enrichment company and an attempt to map the world’s uranium production to where it is enriched and ultimately…
-
Photons vs electrons: laser quest?

Some commentators say the 21st century will be the ‘age of the electron’. But in computing/communications, the photon has long been displacing the electron. This 17-page note gives an overview. It matters as moving data is 50-90% of data center energy use. We contrast fiber vs copper; and explore AI power, optical computing, and a…
Content by Category
- Batteries (84)
- Biofuels (42)
- Carbon Intensity (49)
- CCS (63)
- CO2 Removals (9)
- Coal (36)
- Company Diligence (85)
- Data Models (790)
- Decarbonization (156)
- Demand (103)
- Digital (50)
- Downstream (44)
- Economic Model (194)
- Energy Efficiency (75)
- Hydrogen (63)
- Industry Data (260)
- LNG (48)
- Materials (77)
- Metals (69)
- Midstream (43)
- Natural Gas (144)
- Nature (75)
- Nuclear (22)
- Oil (161)
- Patents (38)
- Plastics (43)
- Power Grids (116)
- Renewables (147)
- Screen (107)
- Semiconductors (30)
- Shale (50)
- Solar (66)
- Supply-Demand (45)
- Vehicles (88)
- Wind (40)
- Written Research (331)
Show More