Search results for: “direct air capture”
-
New energies deflation: myths and legends?
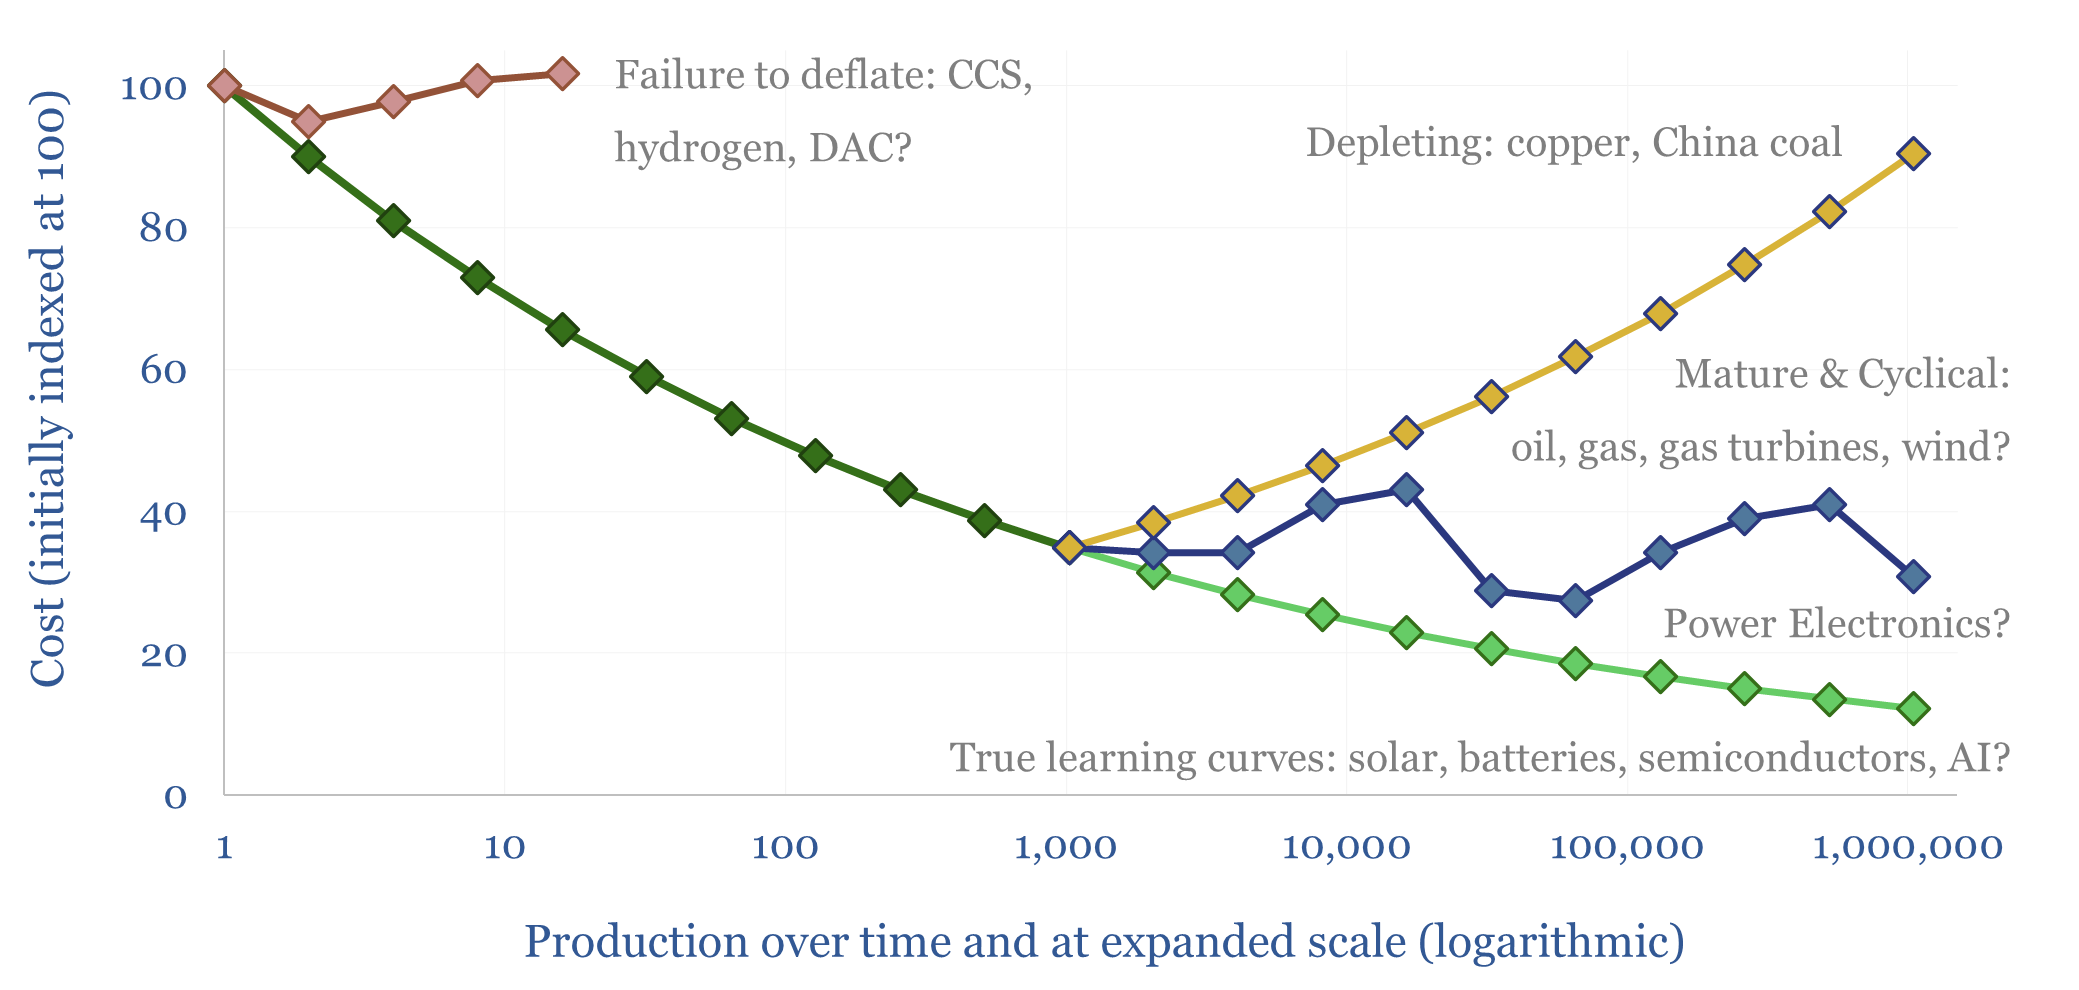
How much of the market’s current disenchantment with new energies can be attributed to persistently high costs, which failed to deflate as much as hoped? This 15-page report reviews the evidence. Cost trajectories have varied. CCS and hydrogen cost more than initially advertised. Wind costs recently re-inflated. Yet, solar, electronics and lithium ion batteries remain…
-
Liquefied CO2 carriers: CO2 shipping costs?
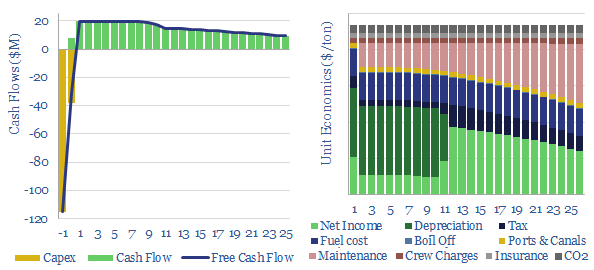
This model captures the economics of a CO2 carrier, i.e., a large marine vessel, carrying liquefied CO2, at -50ºC temperature and 6-10 bar pressure, for CCS. A good rule of thumb is seaborne CO2 shipping costs are $8/ton/1,000-miles. Shipping rates of $100k/day yield a 10% IRR on a c$150M tanker.
-
Uranium enrichment: by country, by company, by facility?
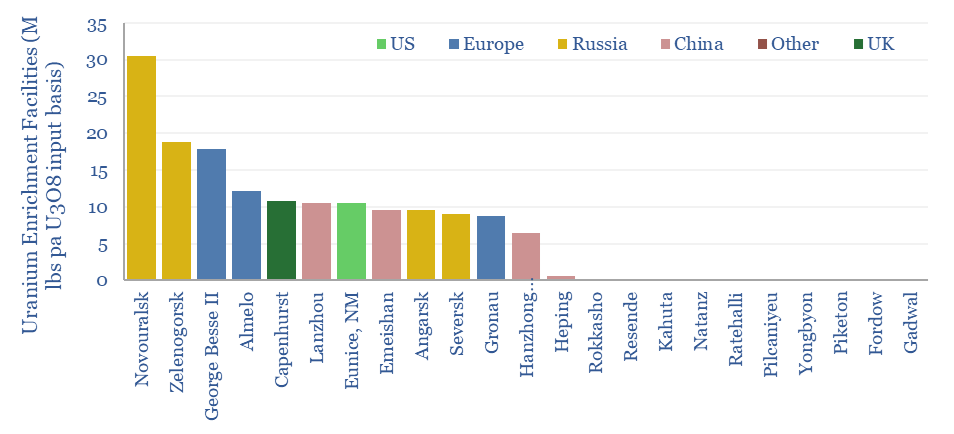
Global uranium enrichment by country, by company and by facility are estimated in this data-file, covering the 155M lbs pa uranium market. The data-file includes a build-up of enrichment facilities (ranked by SWU capacity), notes on each enrichment company and an attempt to map the world’s uranium production to where it is enriched and ultimately…
-
US nuclear generation by company?
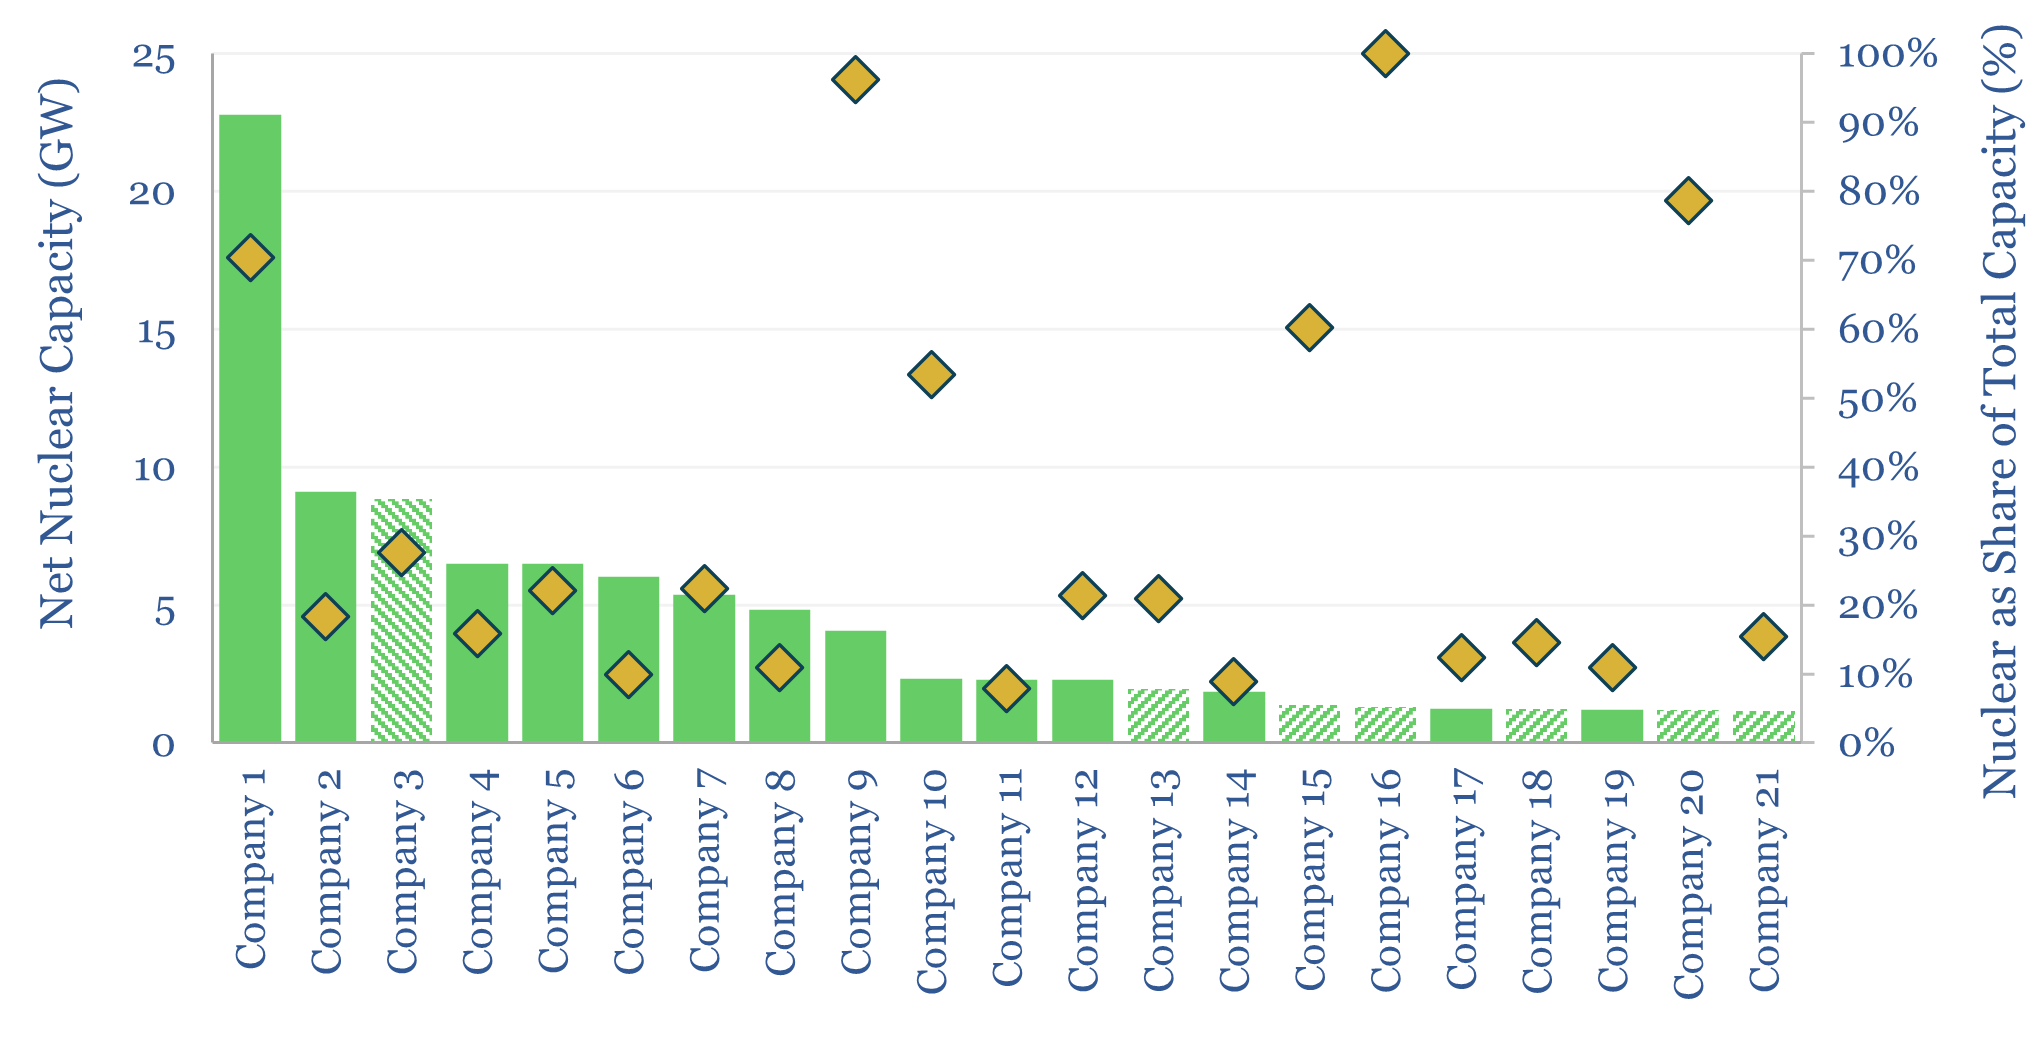
US nuclear generation of 800 TWH pa has come from 94 reactors, at 65 nuclear plants, owned by c50 companies, with 102 GW of current capacity. This data-file breaks down the industry by plant and by owner/operator, and assesses the restart potential of shuttered nuclear plants.
-
Decarbonize shipping: alternative fuel costs?
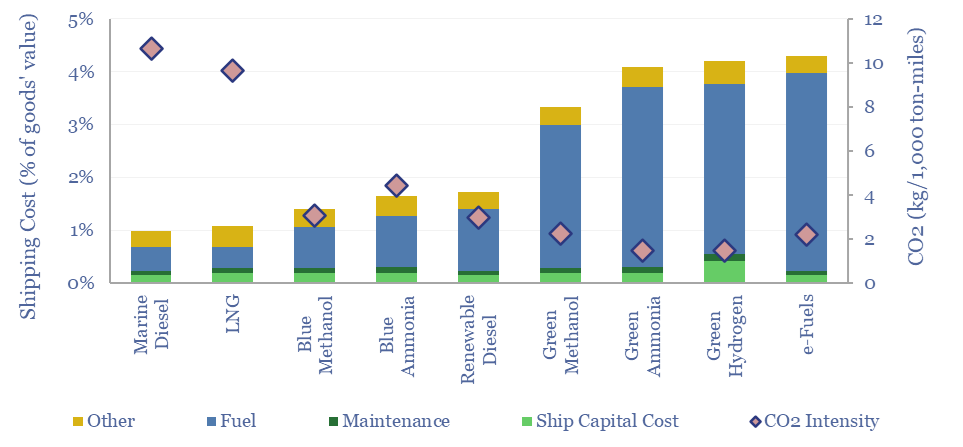
This data-file screens the costs of alternative shipping fuels, such as LNG, blue methanol, blue ammonia, renewable diesel, green methanol, green ammonia, hydrogen and e-fuels versus marine diesel. Shipping costs rise between 10% to 3x, inflating the ultimate costs of products by 0.1-30%, for CO2 abatement costs of $130-1,000/ton. We still prefer CO2 removals.
-
Leading PGM producers: mining, refining and recycling?
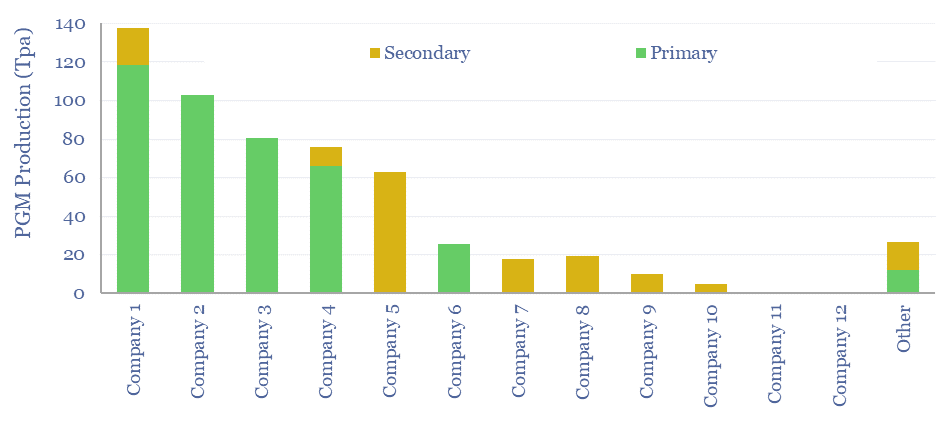
This data-file is a screen of leading PGM producers and recyclers. Eight companies control 90% of global production. Most are mid-caps. Four have primary listings in South Africa. Three are listed in Europe and the UK. Ore grades average 4 grams/ton, and recovery requires 60GWH/ton of energy, emitting 40kT/ton of CO2. But do recent company…
-
Market sizing: what if CO2 abatement costs are distributed like US income?
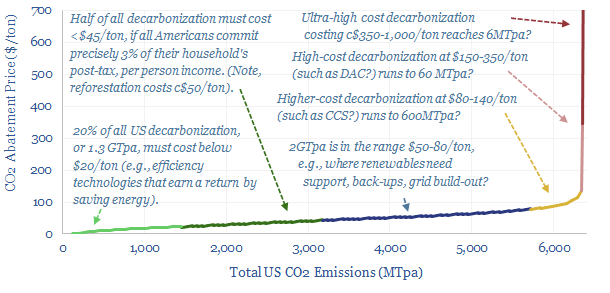
How would CO2 abatement costs end up being distributed, if they matched the distribution of US incomes? 90% of all decarbonization would have to cost less than $80/ton. There could be 600MTpa of CCS, 60MTpa of DAC, 6MTpa of green hydrogen and e-fuels?
-
Sugar to ethanol: the economics?
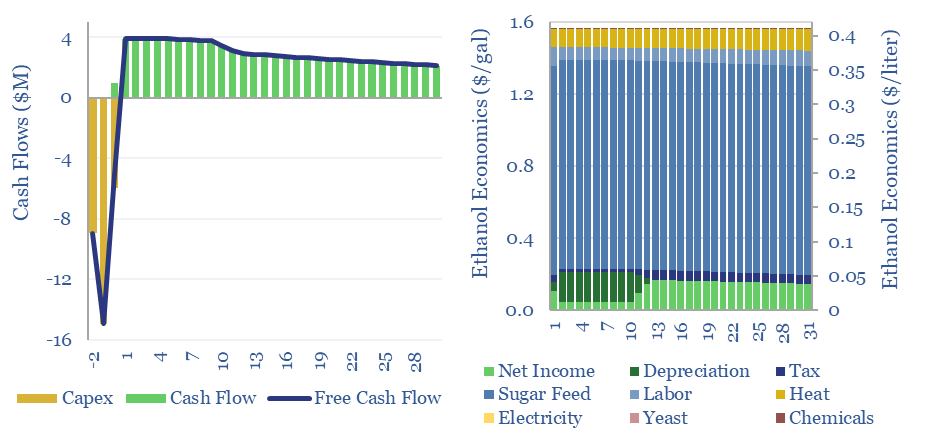
This data-file captures the economics of ethanol production, as a biofuel derived from sugar. A 10% IRR requires $1-4/gallon ethanol, equivalent to $0.25-1/liter, or $60-250/boe. Economics are most sensitive to input sugar prices. Net CO2 intensity is at least 50% lower than hydrocarbons.
-
CCS: what CO2 purity for transport and disposal?
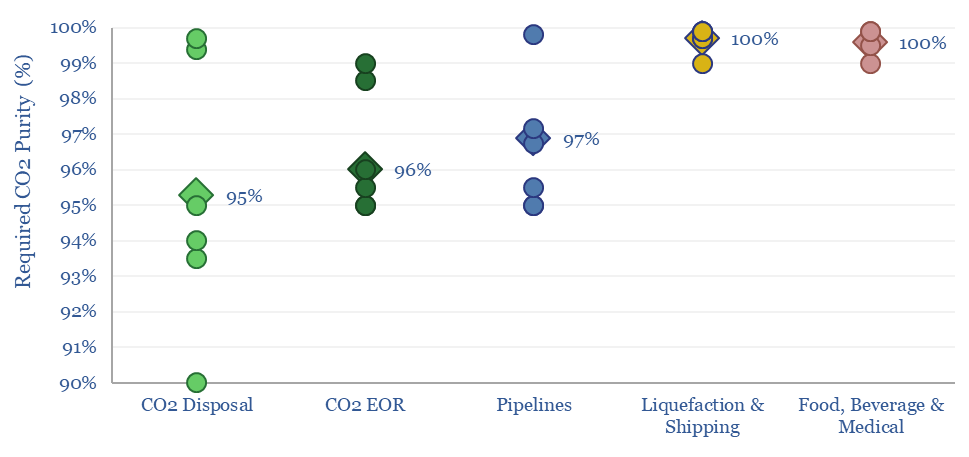
The minimum CO2 purity for CCS starts at 90%, while a typical CO2 disposal site requires 95%, CO2-EOR requires 96%, CO2 pipelines require 97% and CO2 liquefaction or shipping requires >99%. This data-file aggregates numbers from technical papers and seeks to explain CO2 purity for transport and disposal.
-
Electric vehicle: battery life?
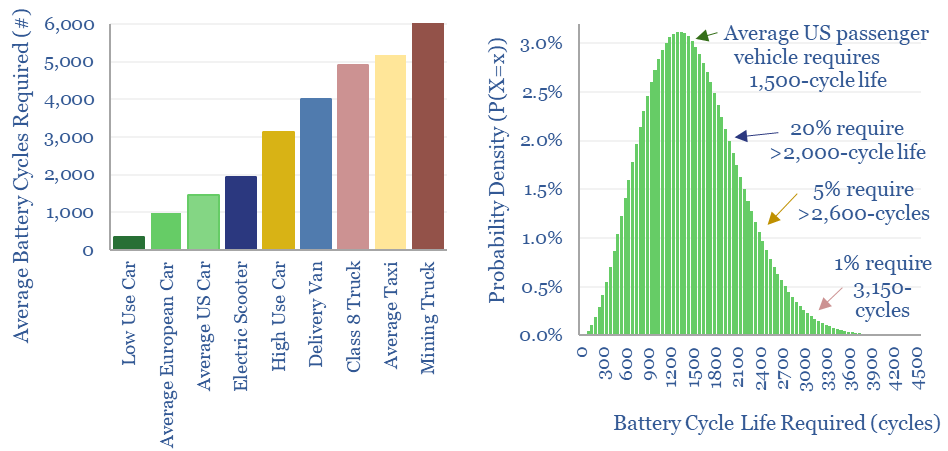
Electric vehicle battery life will realistically need to reach 1,500 cycles for the average passenger vehicle, 2,000-3,000 cycles after reflecting a margin of safety for real-world statistical distributions, and 3,000-6,000 cycles for higher-use commercial vehicles. This means lithium ion batteries may be harder to displace with novel chemistries?
Content by Category
- Batteries (89)
- Biofuels (44)
- Carbon Intensity (49)
- CCS (63)
- CO2 Removals (9)
- Coal (38)
- Company Diligence (95)
- Data Models (840)
- Decarbonization (160)
- Demand (110)
- Digital (60)
- Downstream (44)
- Economic Model (205)
- Energy Efficiency (75)
- Hydrogen (63)
- Industry Data (279)
- LNG (48)
- Materials (82)
- Metals (80)
- Midstream (43)
- Natural Gas (149)
- Nature (76)
- Nuclear (23)
- Oil (164)
- Patents (38)
- Plastics (44)
- Power Grids (130)
- Renewables (149)
- Screen (117)
- Semiconductors (32)
- Shale (51)
- Solar (68)
- Supply-Demand (45)
- Vehicles (90)
- Wind (44)
- Written Research (354)