Search results for: “gas”
-
Water intensity of power generation?
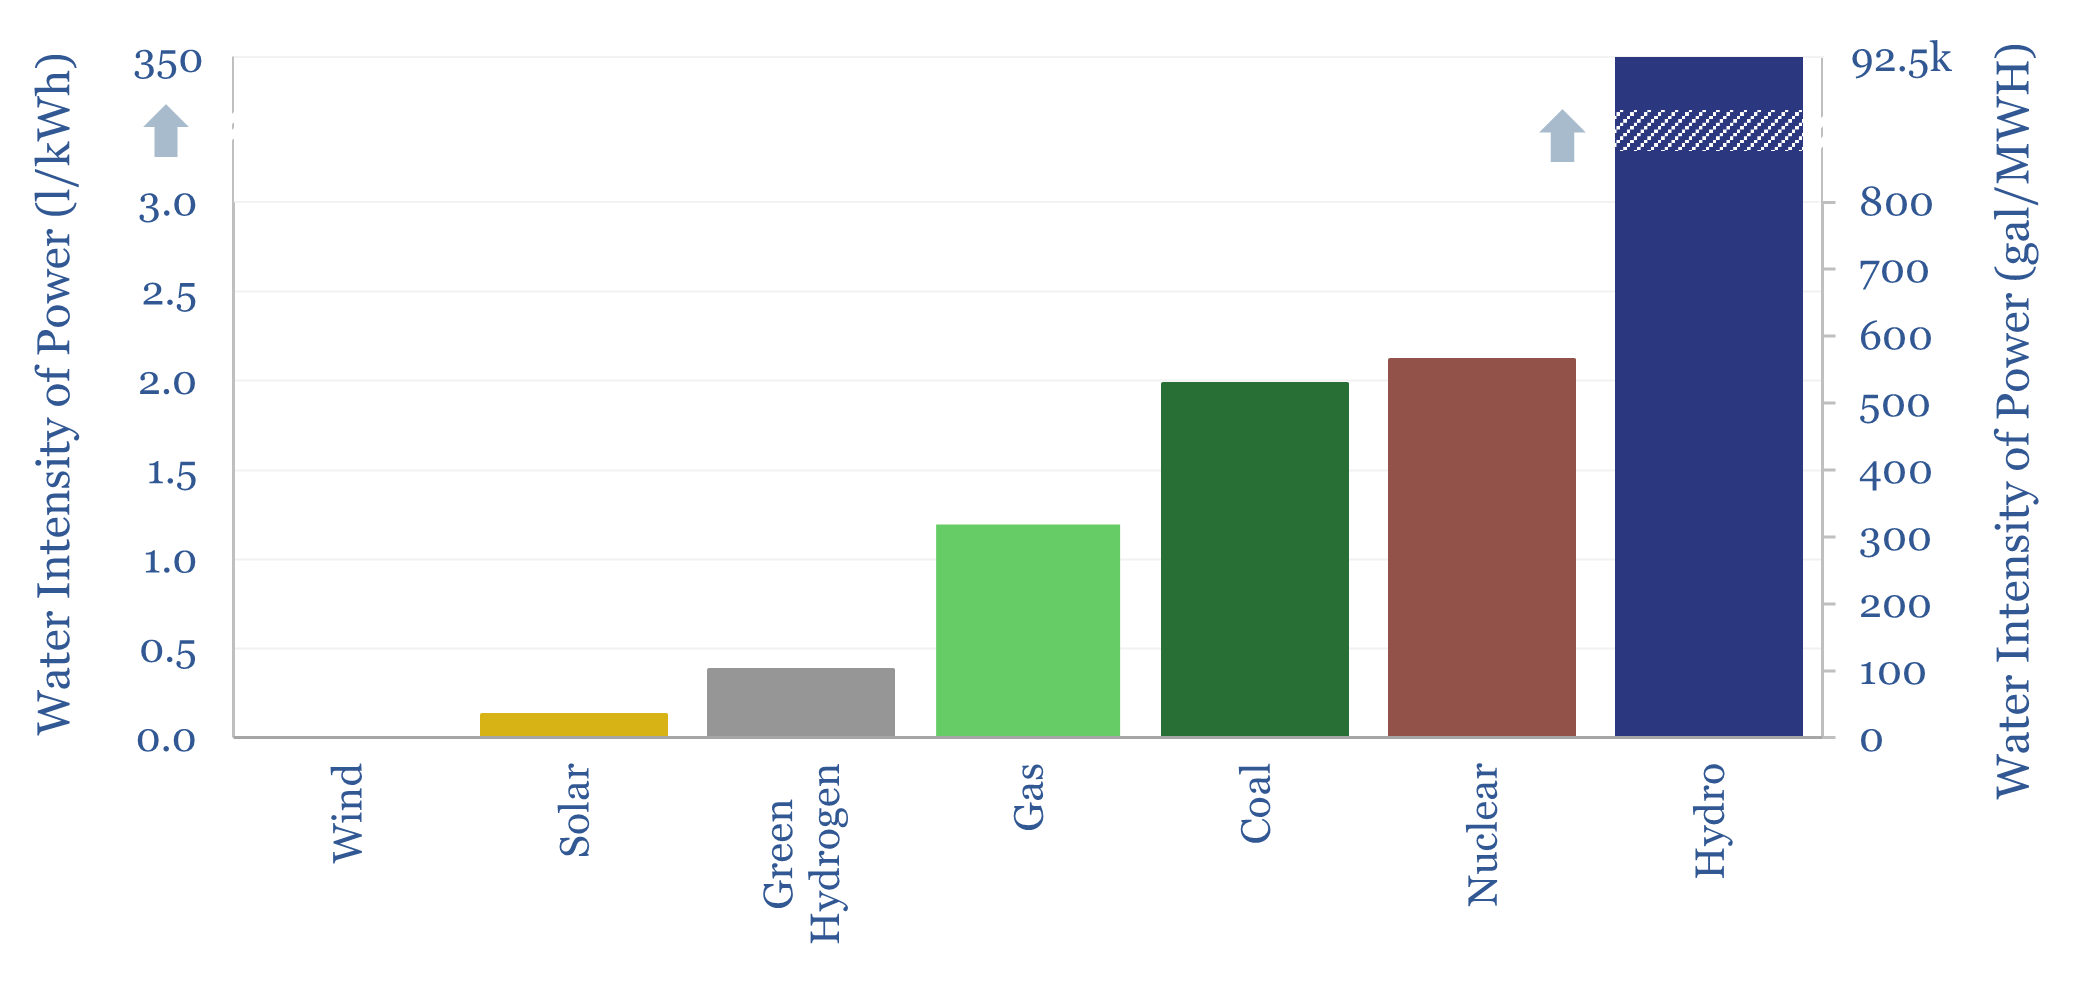
The water intensity of US power generation averages 21 liters per kWh (5,600 gallons per MWH), but 95% of this total comes from evaporation at hydro reservoirs. Excluding hydro power, good estimates are that nuclear power uses 2.1 liters/kWh of water, coal power uses 2 liters/kWh and CCGTs use 1.2 liters/kWh, or less in some…
-
Leilac low-carbon cement technology?
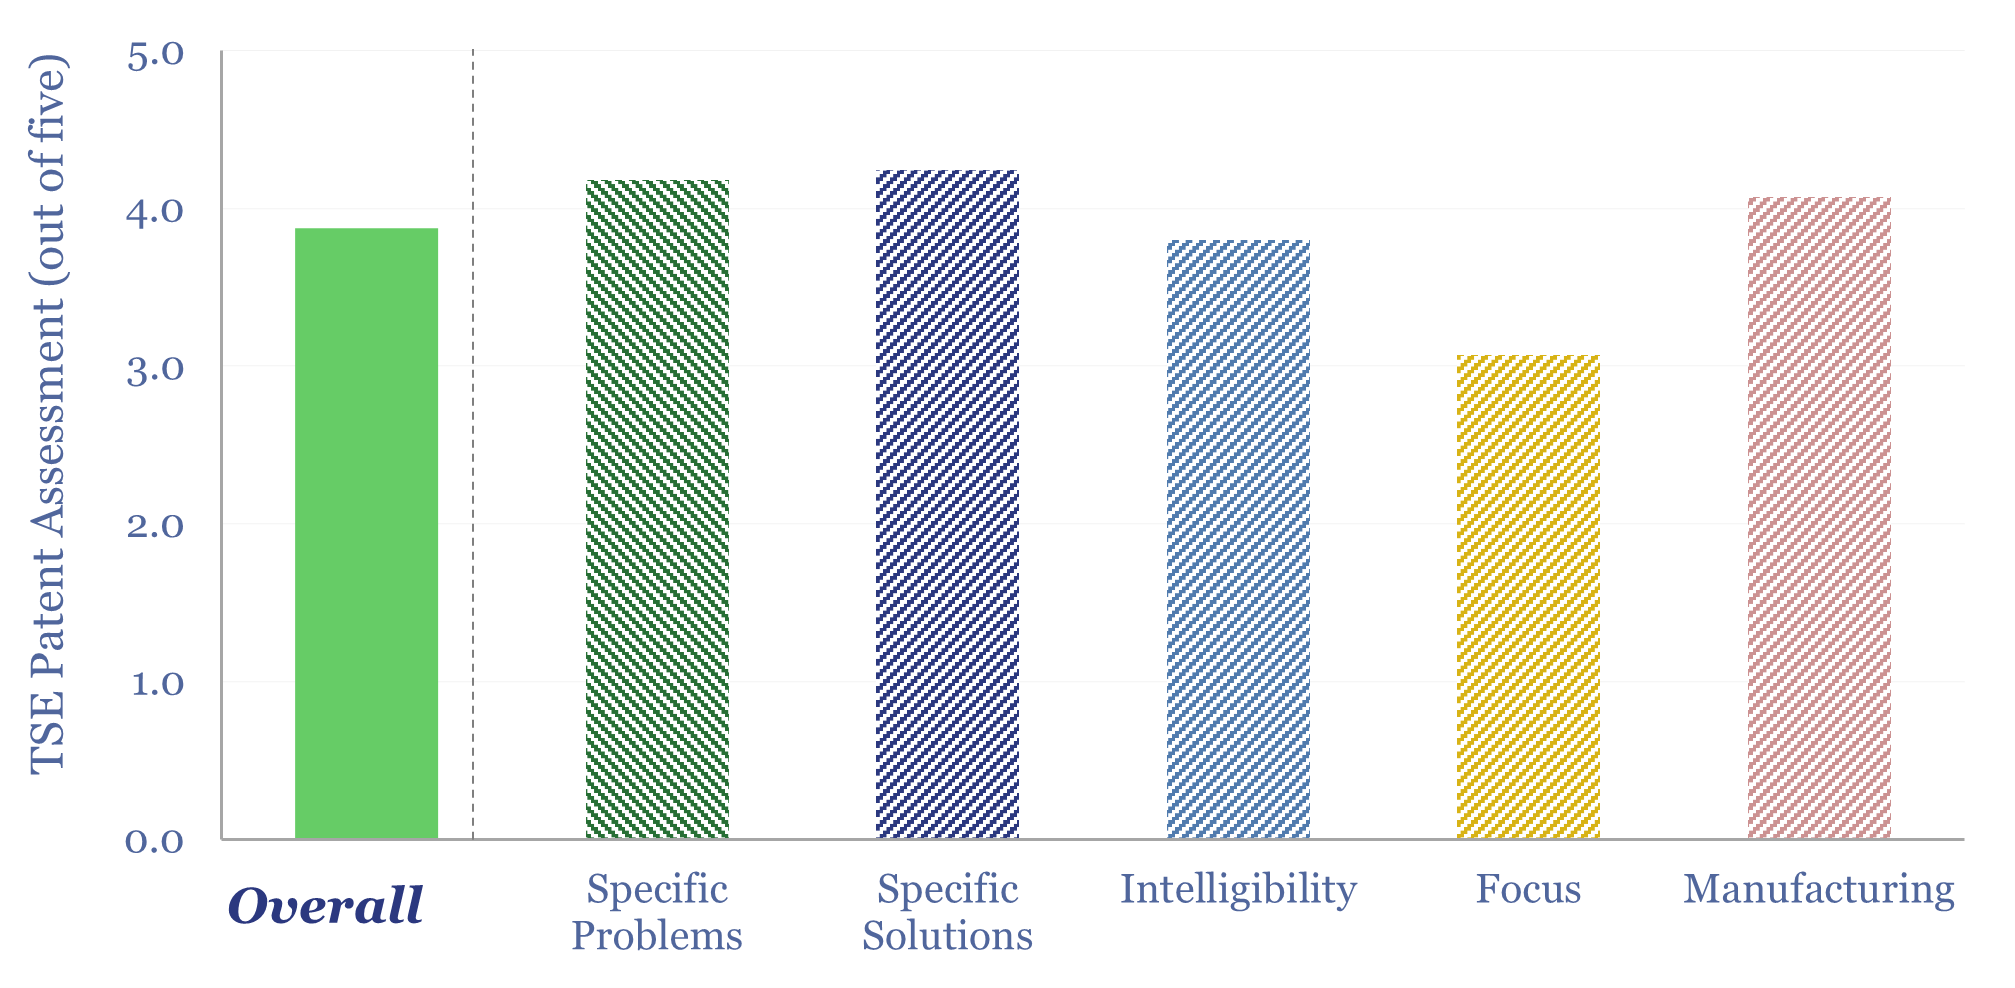
This data-file explores Leilac low-carbon cement technology, which separates the calcination stage, within an indirectly heated reactor, so that 98% pure CO2 can be gathered and sequestered, with requiring post-combustion CCS (amines). Patents from parent company, Calix, lock up the technology, with clear and intelligible details, although this also shows where the challenges are.
-
Power plant cooling: adapting for water scarcity?
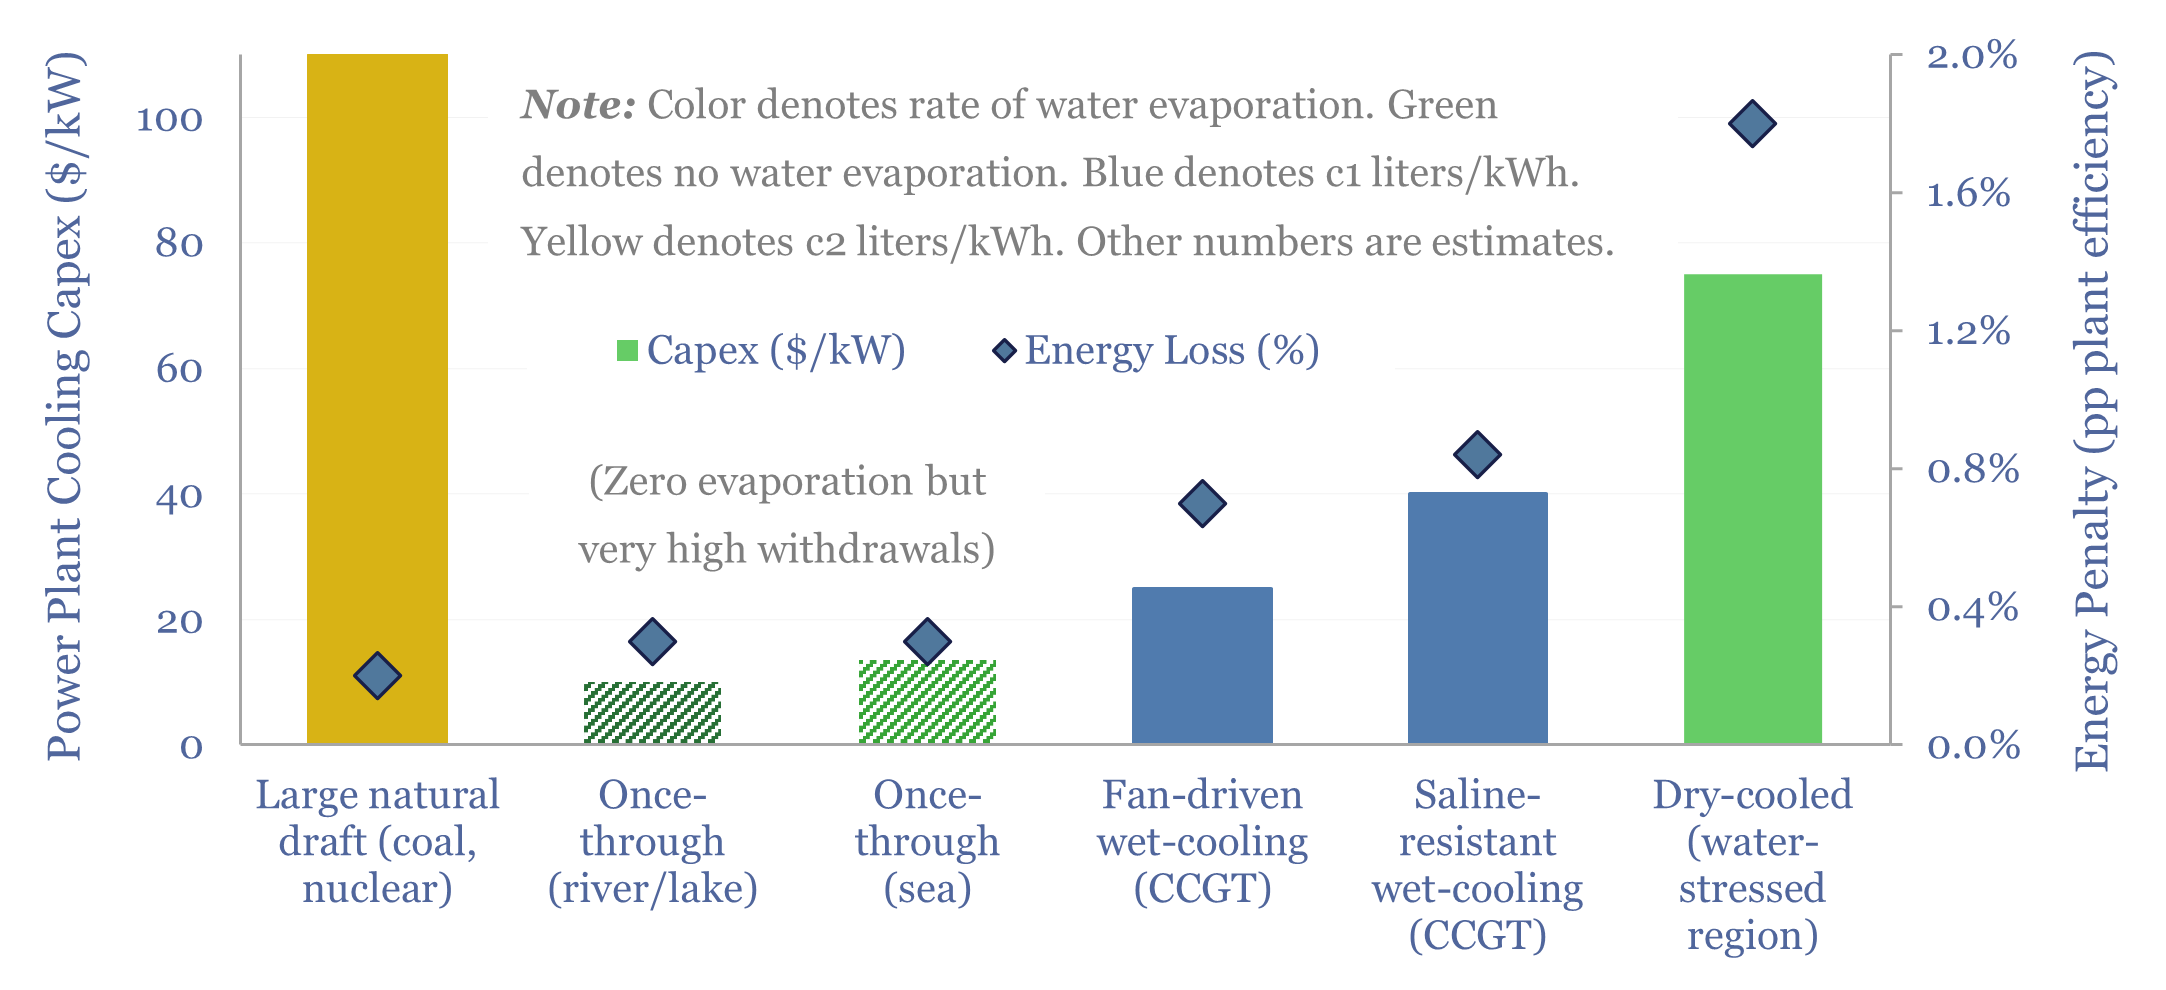
Water is needed to condense steam, downstream of the steam turbines, in nuclear, coal and CCGT power plants. But thermal power demands and fresh water scarcity are both structurally rising. Hence this 16-page report explores how the energy industry might adapt, trends in power plant cooling, and who benefits.
-
Peak power demand by region (and case studies)

This data-file tracks the timing and magnitude of peak power demand, across different grids in the North Hemisphere, with case studies. This matters for grid-planning, gas peakers and batteries. In the US, peak demand is typically driven by high AC loads in summer heatwaves. In Europe’s milder climate, only c10% of homes have AC, and…
-
Global commodity demand: sensitivity to GDP?
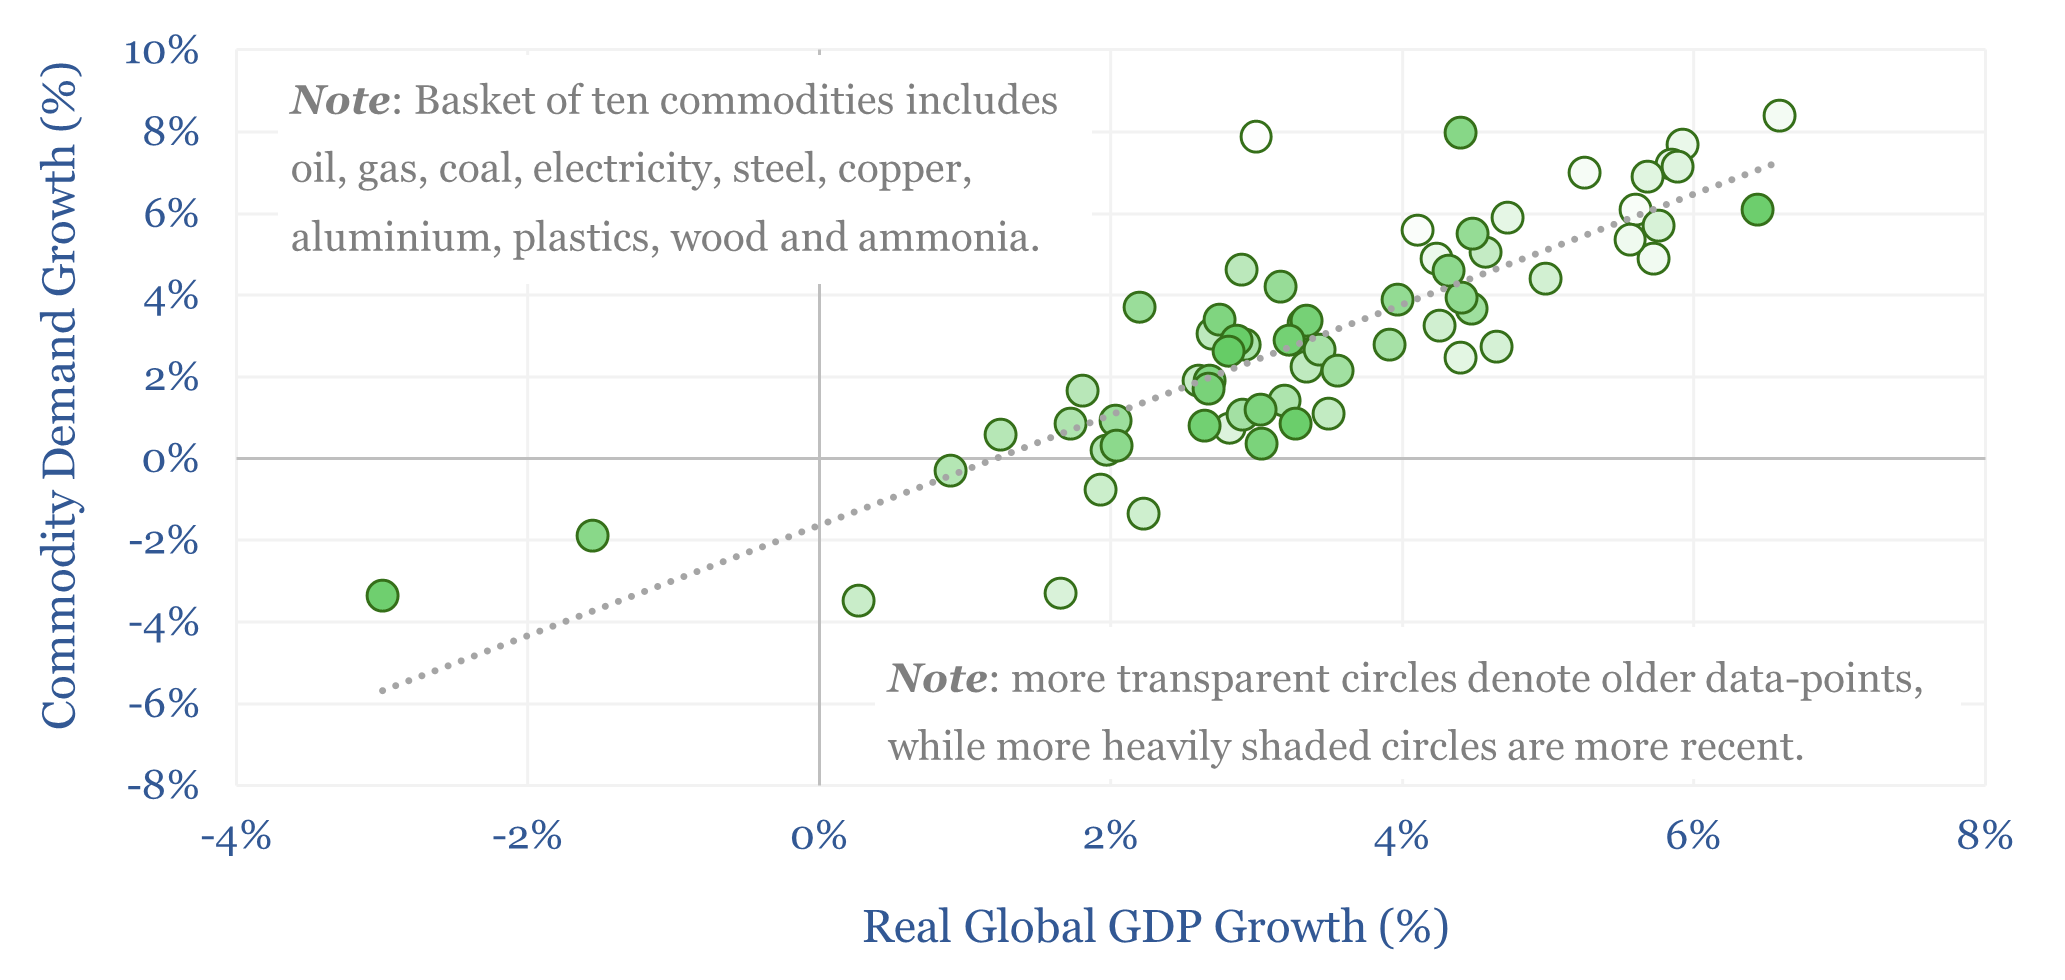
Global commodity demand is levered to GDP. Specifically, for each +/- 1% acceleration or deceleration in global GDP, commodity demand tends to accelerate or decelerate by +/- 1.4%, with a 70% R-squared, across 25 examples that are indexed in this data-file. Oil demand sensitivity to GDP is particularly interesting.
-
Rare Earth market: by metal, by use, by value?
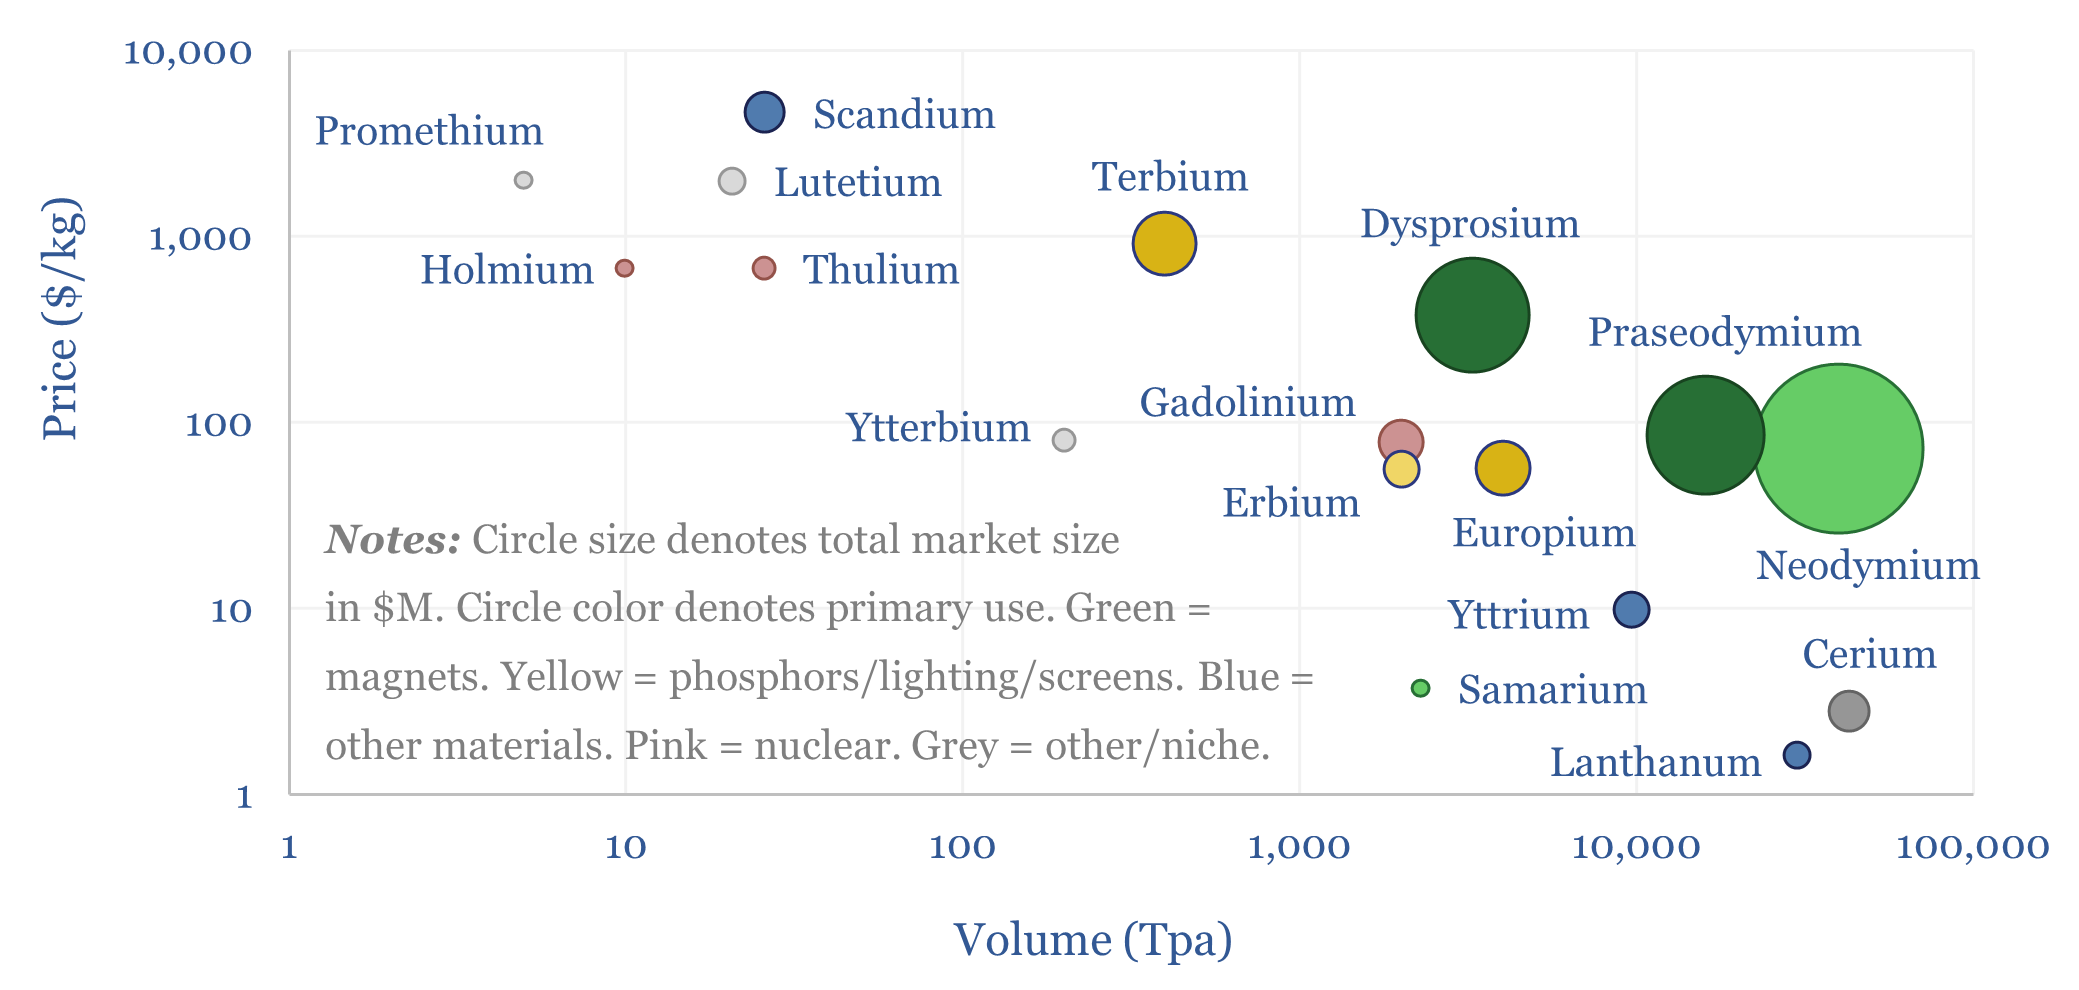
The global Rare Earth market is 390kTpa of mined Rare Earth Oxide equivalents, which is processed to yield 150kTpa of sellable Rare Earth materials, with a value of $7bn pa. But “price” is not “value”. This data-file breaks down the global Rare Earth market, by metal, by price (in $/kg), by volume (in Tpa), and…
-
Where is oil industry R&D focused?
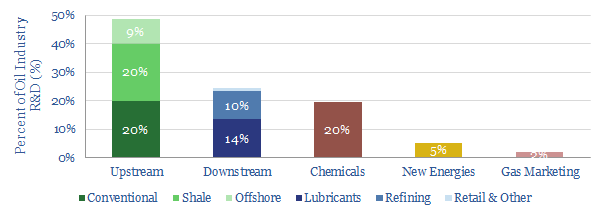
Shale comprises c5% of global supply and c20% of global R&D; while offshore comprises c30% of global supply, but <10% of global R&D, according to our estimates. This simple file aims to break down the oil and gas industry’s R&D activities, by category and sub-category, based on the >1,000 patents and >300 SPE papers we…
-
Offshore Economics: the Impact of Technology
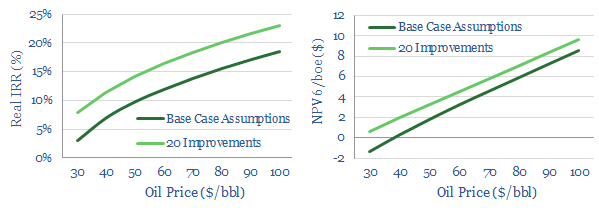
This data-file quantifies the impact that technology can have on offshore economics. A typical offshore oilfield is modelled across 250 lines. The project is then re-modelled capturing our “top twenty” offshore technologies, to quantify the potential improvement: a doubling of NPV6, and a c4-5% improvement in IRR.
-
LNG plant footprints: compaction costs?
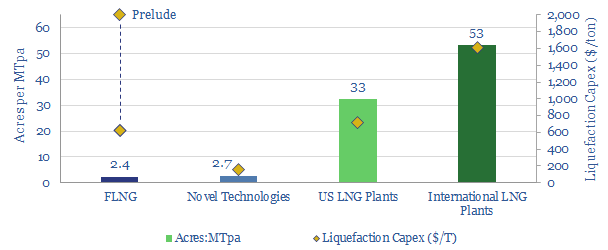
This data file tabulates the acreage footprints of c20 recent LNG projects. FLNG is 20x more compact than a comparable onshore plant, which may elevate costs. To benefit from compactness, we see more potential in novel “liquefaction” technologies.
-
Our Top Technologies for IMO 2020
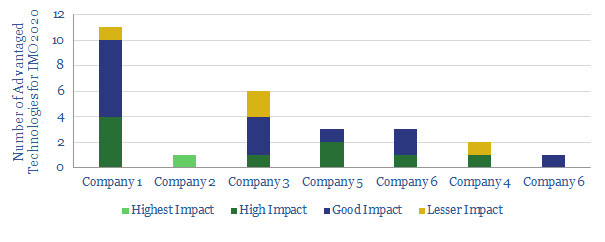
We review the top, proprietary technologies that we have seen from analysing patents and technical papers, to capitalise on IMO 2020 sulphur regulation, across the world’s leading integrated oil companies.
Content by Category
- Batteries (89)
- Biofuels (44)
- Carbon Intensity (49)
- CCS (63)
- CO2 Removals (9)
- Coal (38)
- Company Diligence (94)
- Data Models (838)
- Decarbonization (160)
- Demand (110)
- Digital (59)
- Downstream (44)
- Economic Model (204)
- Energy Efficiency (75)
- Hydrogen (63)
- Industry Data (279)
- LNG (48)
- Materials (82)
- Metals (80)
- Midstream (43)
- Natural Gas (148)
- Nature (76)
- Nuclear (23)
- Oil (164)
- Patents (38)
- Plastics (44)
- Power Grids (130)
- Renewables (149)
- Screen (117)
- Semiconductors (32)
- Shale (51)
- Solar (68)
- Supply-Demand (45)
- Vehicles (90)
- Wind (44)
- Written Research (354)