Search results for: “power electronics”
-
Power capacity of a typical home?
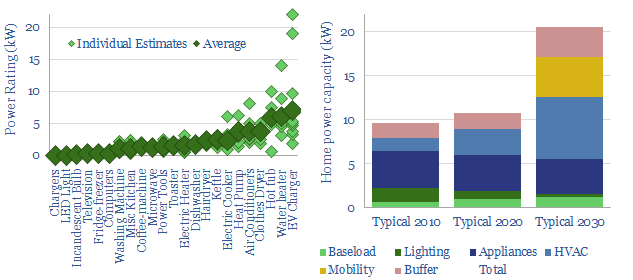
A typical home in the developed world currently has a 10kW maximum power capacity before tripping its circuit-breaker (although it varies). This could easily double in the energy transition, due to phasing back gas heating, gas cooking and the addition of home charging stations for electric vehicles.
-
Sentient Energy: smart grid breakthrough?
This data-file is a technology review for Sentient Energy, assessing innovations in smart grids. Its technology can achieve energy savings via a combination of “Conservation Voltage Reduction” and “Volt-VAR optimization at the grid edge”. This also helps to integrate more solar and EV charging into power grids. We explain the technology.
-
Power transmission: the economics?
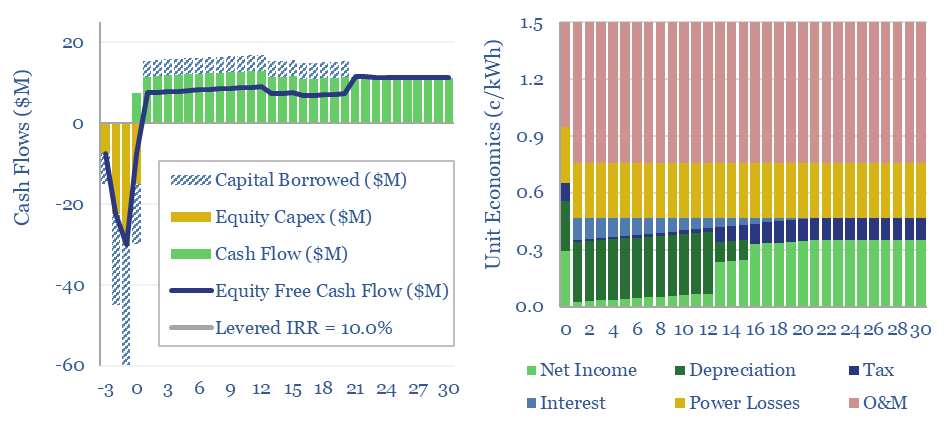
This data-file captures the costs of AC power transmission, requiring a 1.5c/kWh spread to earn a 10% levered IRR on a new 100km and 1,000MW transmission line, with capex costs of $1.5/kW-km. These numbers are supported by backup tabs, tabulating the costs of recent projects and a full granular breakdown for the capex costs of…
-
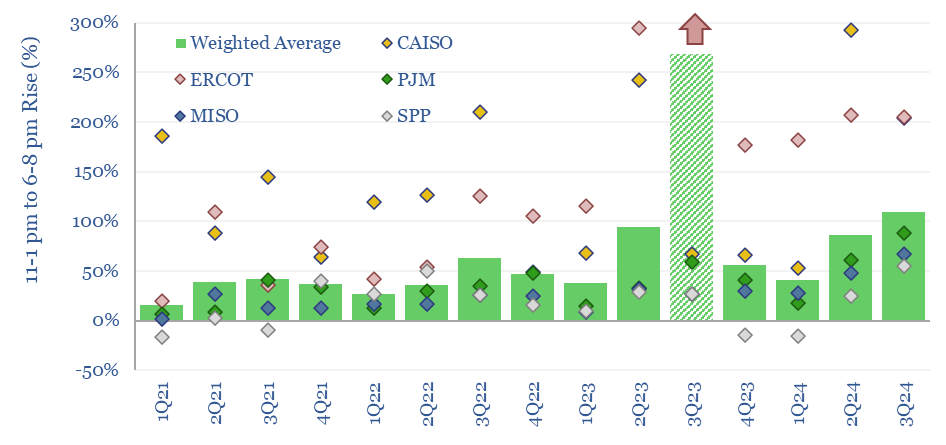
Peak power demand by region (and case studies)

This data-file tracks the timing and magnitude of peak power demand, across different grids in the North Hemisphere, with case studies. This matters for grid-planning, gas peakers and batteries. In the US, peak demand is typically driven by high AC loads in summer heatwaves. In Europe’s milder climate, only c10% of homes have AC, and…
-
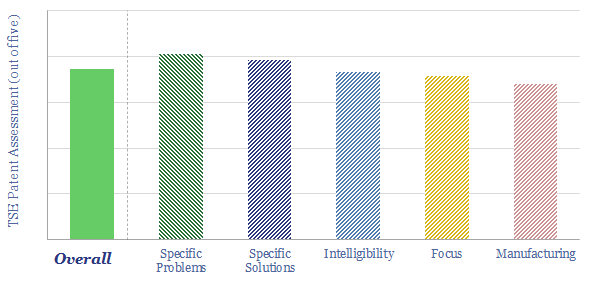
New energies: filter feeder?
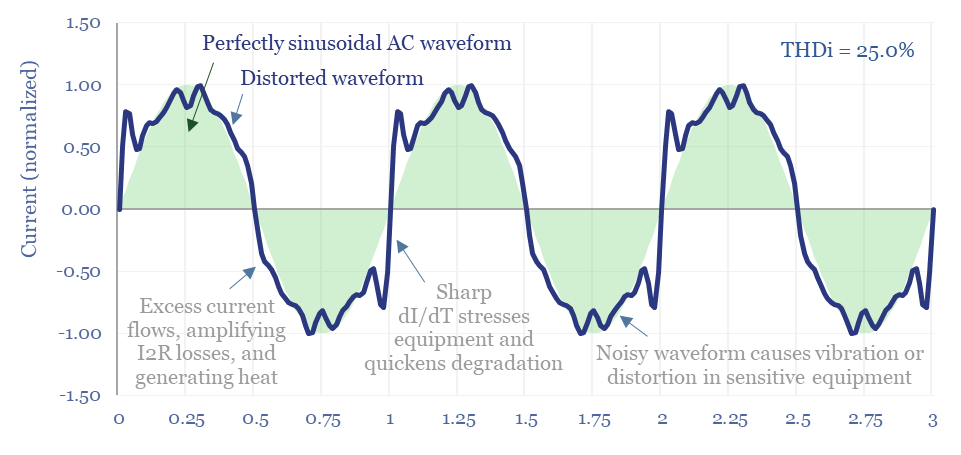
The $1bn pa harmonic filter market likely expands by 10x in the energy transition, as almost all new energies and digital technologies inject harmonic distortion to the grid. This 17-page note argues for premiumization in power electronics, including around solar, and screens for who benefits?
-
Global trade: imports and exports, by product, by region?
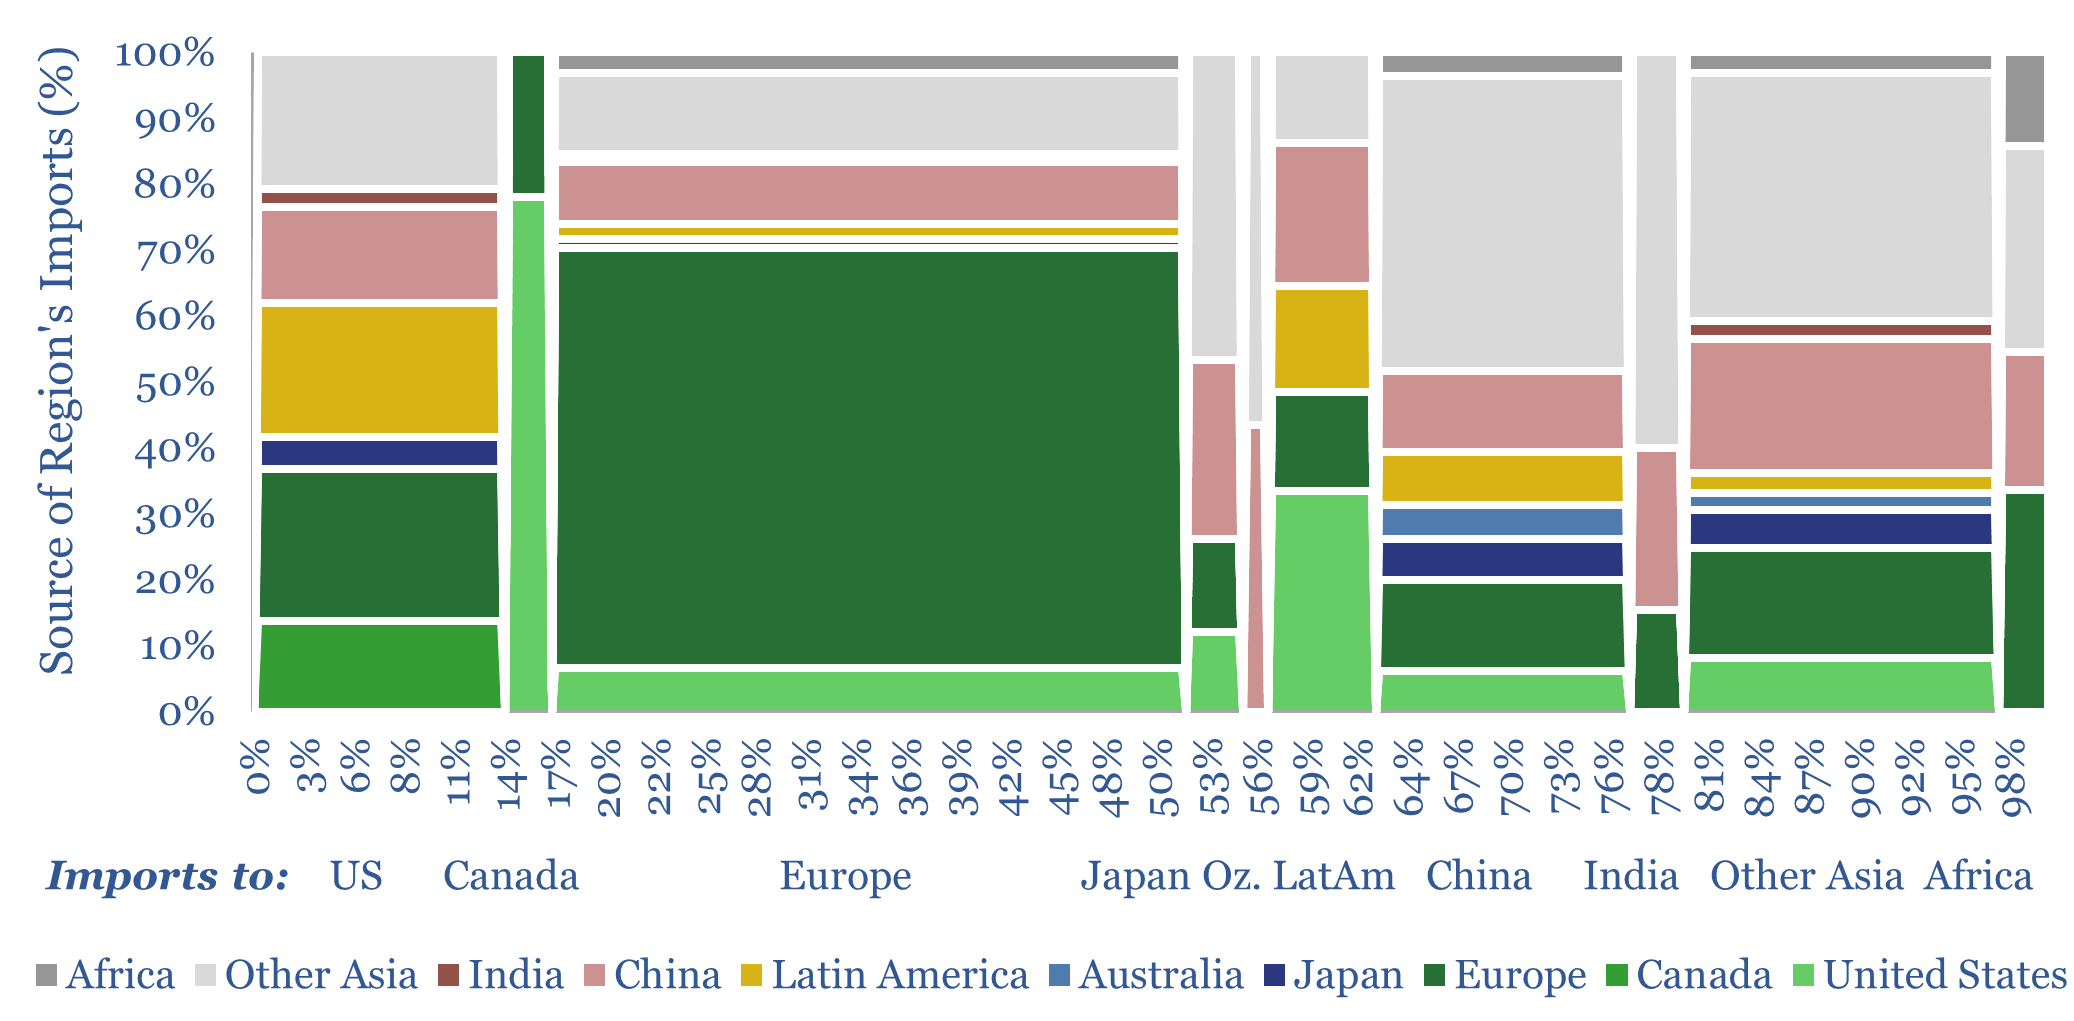
Global trade is set to hit a new peak of $33trn in 2024 (30% of global GDP), of which 70-80% is for goods and 20-30% is for services. This data-file disaggregates global trade by product by region, across c20 categories of energy, materials and capital goods, which we follow in our research, and which are…
-
Battery degradation: causes, effects & implications?
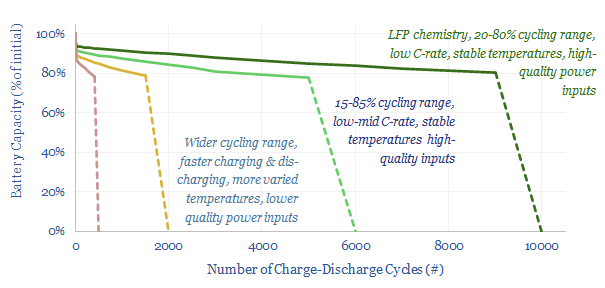
This 14-page note offers five rules of thumb to maximize the longevity of lithium-ion batteries, in grid-scale storage and electric vehicles. The data suggest hidden upside in the demand for batteries, for lithium and high-quality power electronics, especially if batteries are to backstop renewables.
-
Silicon carbide: faster switching?
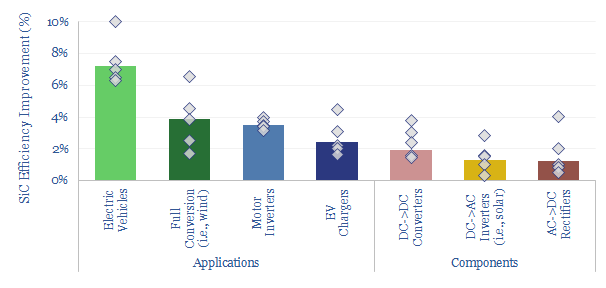
Silicon carbide power electronics will jolt the energy transition forwards, displacing silicon, and improving the efficiency of most new energies by 1-10 pp. Hence we wonder if this disruptor will surprise to the upside, quintupling by 2027. This 12-page note reviews the technology, advantages, challenges, and who benefits?
-
Power plants: average capacity?
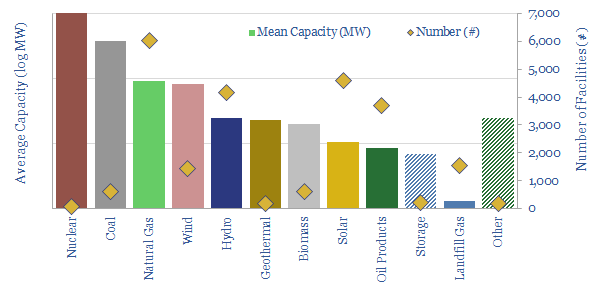
This data-file aggregates granular data into the average capacity of different types of power plants: wind, solar, nuclear, gas, hydro, coal, biomass, landfill gas and geothermal. Energy transition is going to increase the number of inter-connections to the grid by 10-100x.
-
Duck curves: US power price duckiness over time?
In solar-heavy grids, power prices trough around mid-day, then ramp up rapidly as the sunset. This price distribution over time is known as the duck curve. US power prices are getting 25-30% more ducky each year, based on some forms of measurement. Power prices are clearly linked to the instantaneous share of wind/solar in grids.
Content by Category
- Batteries (87)
- Biofuels (42)
- Carbon Intensity (49)
- CCS (63)
- CO2 Removals (9)
- Coal (38)
- Company Diligence (92)
- Data Models (823)
- Decarbonization (159)
- Demand (110)
- Digital (58)
- Downstream (44)
- Economic Model (200)
- Energy Efficiency (75)
- Hydrogen (63)
- Industry Data (276)
- LNG (48)
- Materials (81)
- Metals (75)
- Midstream (43)
- Natural Gas (146)
- Nature (76)
- Nuclear (23)
- Oil (163)
- Patents (38)
- Plastics (44)
- Power Grids (124)
- Renewables (149)
- Screen (112)
- Semiconductors (30)
- Shale (51)
- Solar (67)
- Supply-Demand (45)
- Vehicles (90)
- Wind (43)
- Written Research (347)