Search results for: “shale”
-
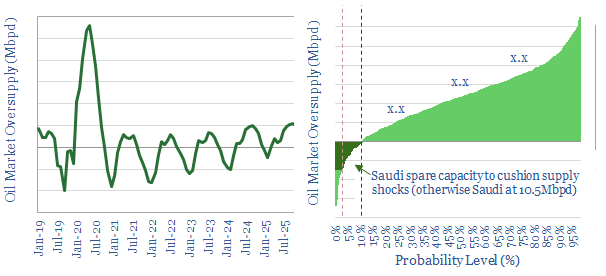
Oil markets: rising volatility?
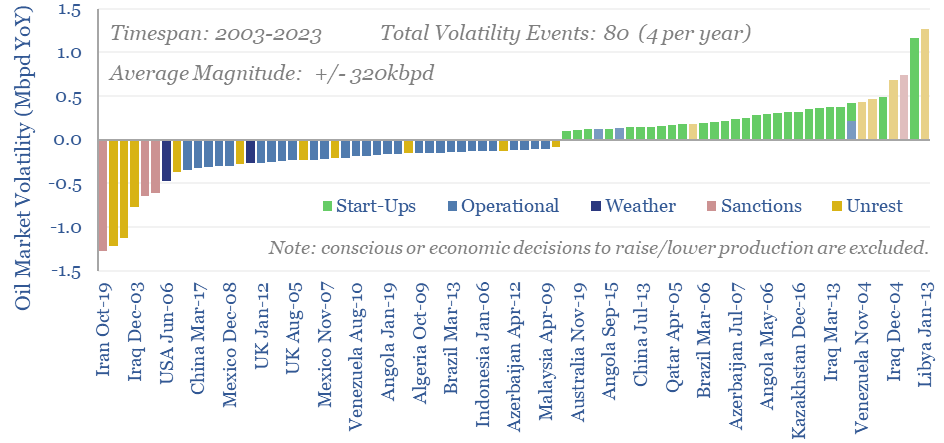
Oil markets endure 4 major volatility events per year, with a magnitude of +/- 320kbpd, on average. Their net impact detracts -100kbpd. OPEC and shale have historically buffered out the volatility, so annual oil output is 70% less volatile than renewables’ output. This 10-page note explores the numbers and the changes that lie ahead?
-
Midstream opportunities in the energy transition?
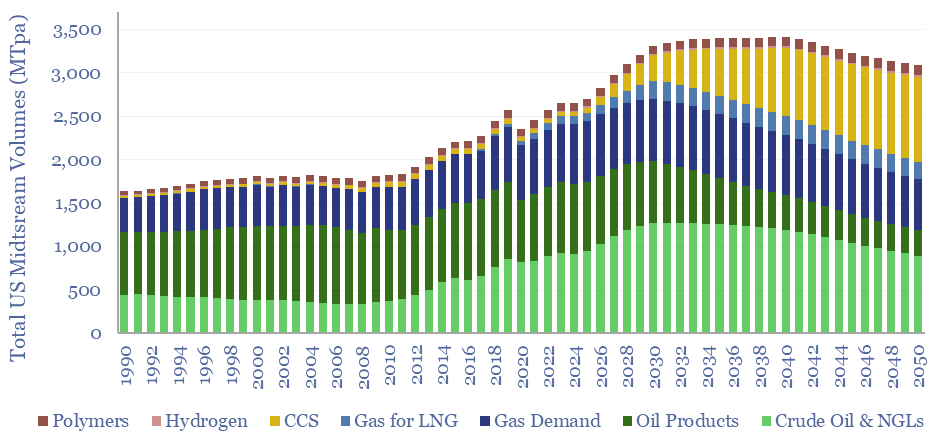
The midstream industry moves molecules, especially energy-molecules, and especially in pipelines. Despite the mega-trend of electrification, there are still strong midstream opportunities in the energy transition, backstopping volatility and moving new molecules. This short note captures our top ten conclusions. (1) Our overall outlook on the US midstream industry sees the total tonnage of molecules…
-
Moving targets: molecules, electrons or bits ?!
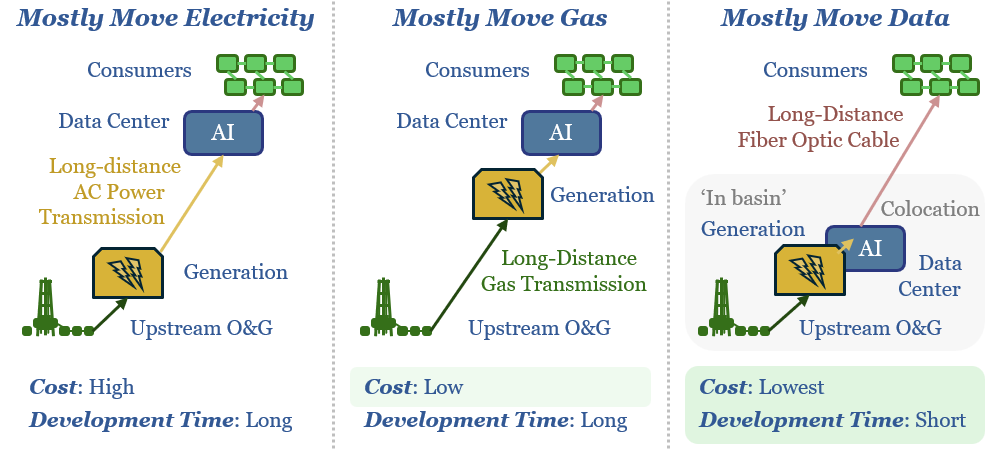
New AI data-centers are facing bottlenecked power grids. Hence this 15-page note compares the costs of constructing new power lines, gas pipelines or fiber optic links for GW-scale computing. The latter is best. Latency is a non-issue. Thus AI reshapes the future of US shale, midstream and fiber-optics?
-
AI and Power Grid Bottlenecks: TSE Presentation, June-2024
Energy transition is entering a new era of power grid bottlenecks linked to the rise of AI, rising volatility, and materials high-grading. These themes are kingmakers for gas, midstream, marketing, efficiency, metals and advanced materials. What matters most for AI is rapidly-available, scalable baseload, which could be decarbonized in the future,at low cost. Hence data-centers…
-
Can technology revive offshore oil?
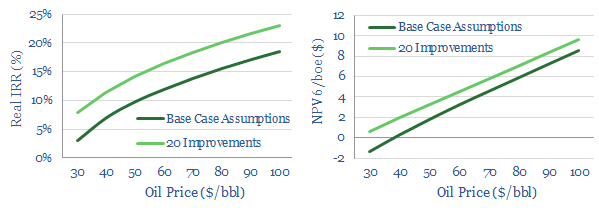
Can technology revive offshore and deep-water? This note outlines our ‘top twenty’ opportunities. They can double deep-water NPVs, add c4-5% to IRRs and improve oil price break-evens by $15-20/bbl.
-
US natural gas: the stuff of dreams?
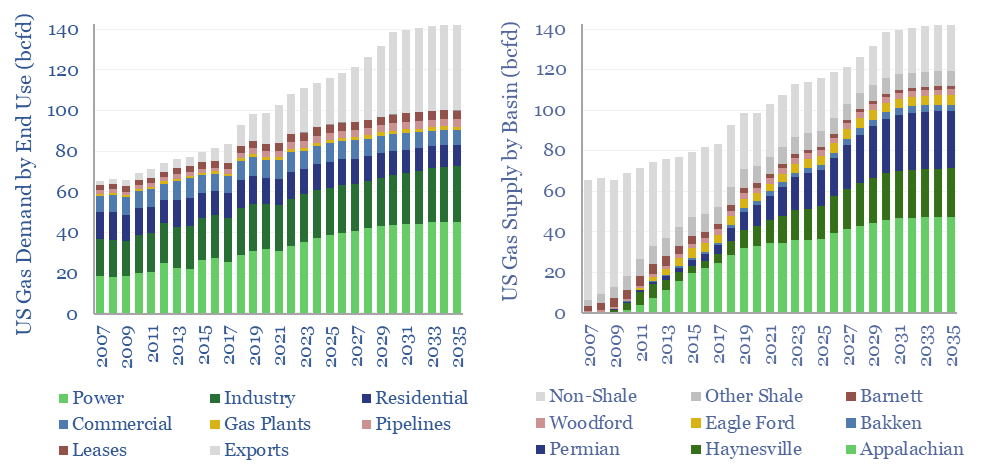
Modeling US gas supply and demand can be nightmarishly complex. Yet we have evaluated both, through 2035. This 13-page report outlines the largest drivers of demand, requires a +3% pa CAGR from the key US shale gas basins, and argues the balance of probability lies to the upside.
-
Global gas turbines by region and over time?
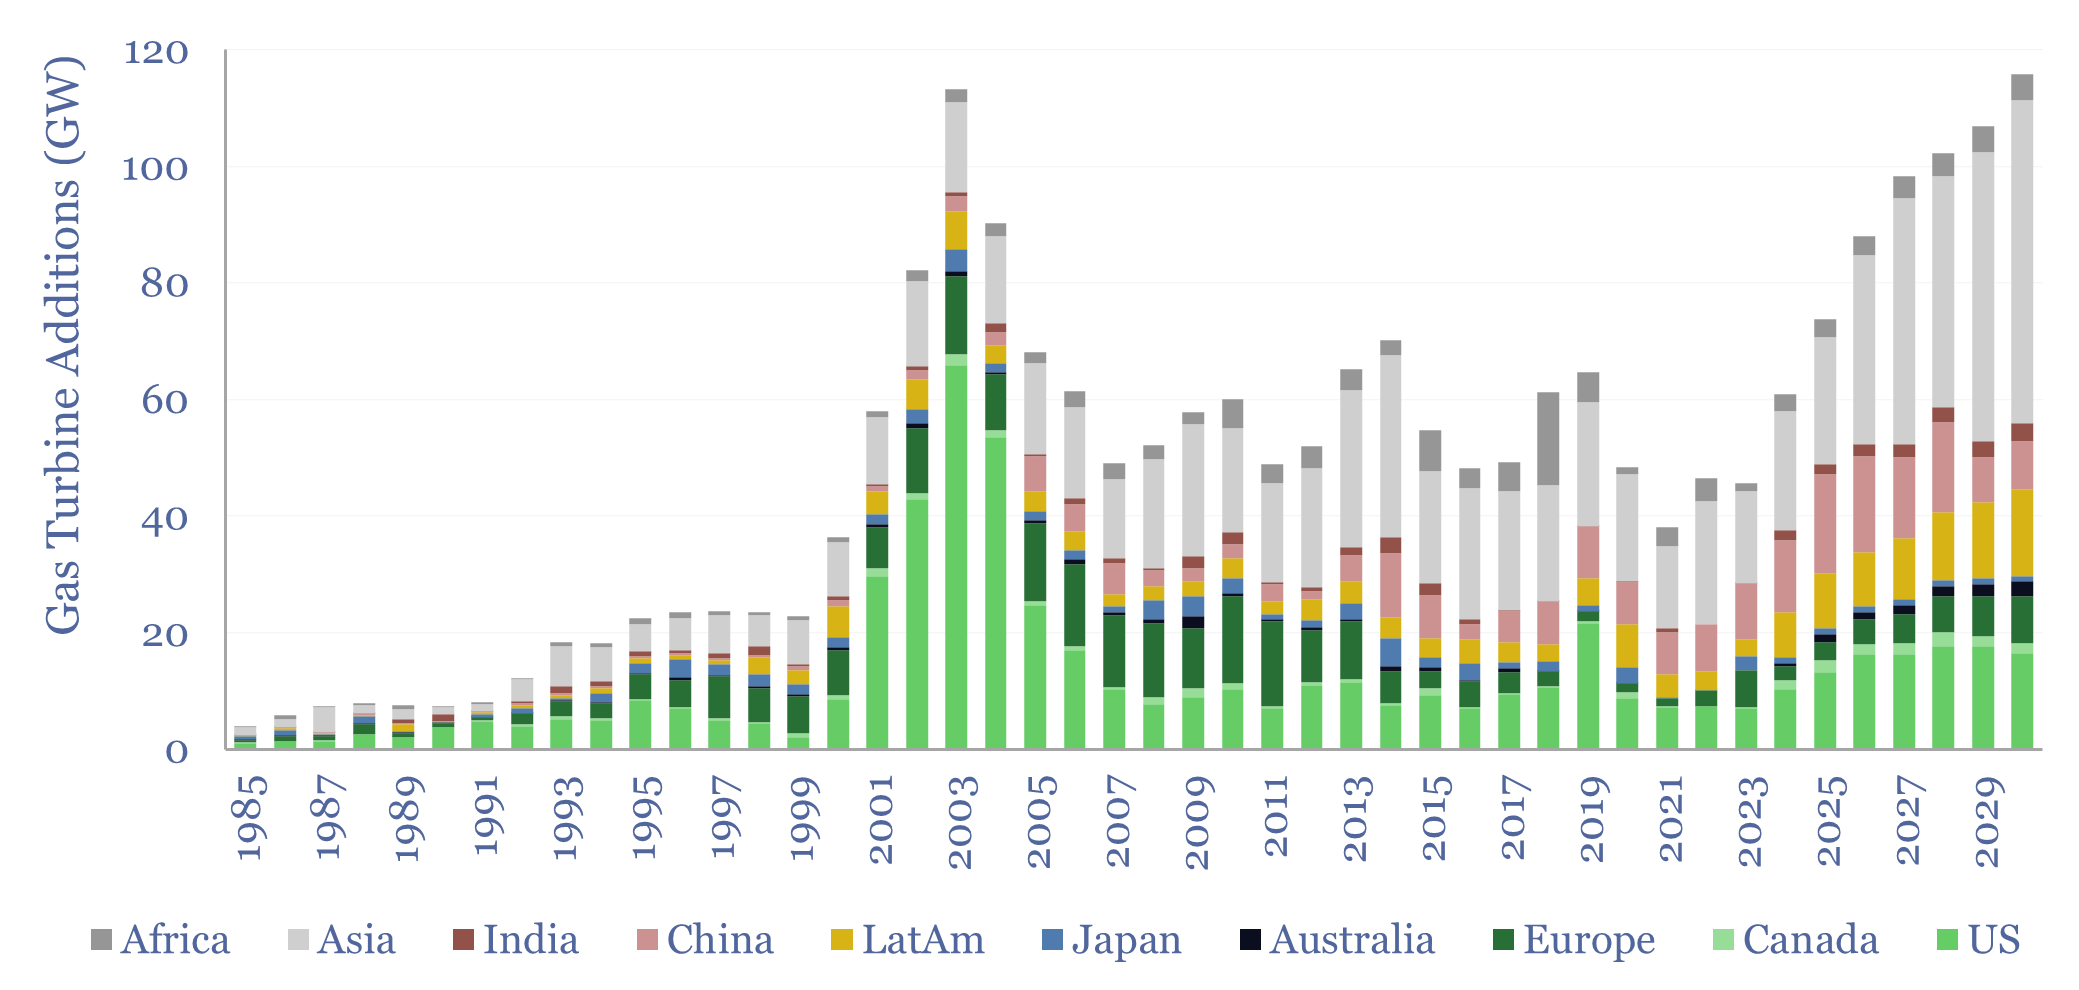
Global gas turbine additions averaged 50 GW pa over the decade from 2015-2024, of which the US was 20%, Europe was 10%, Asia was 50%, LatAm was 10% and Africa was 10%. Yet global gas turbine additions could double to 100 GW pa in 2025-30. This data-file estimates global gas turbine capacity by region and…
-
European gas and power model: natural gas supply-demand?
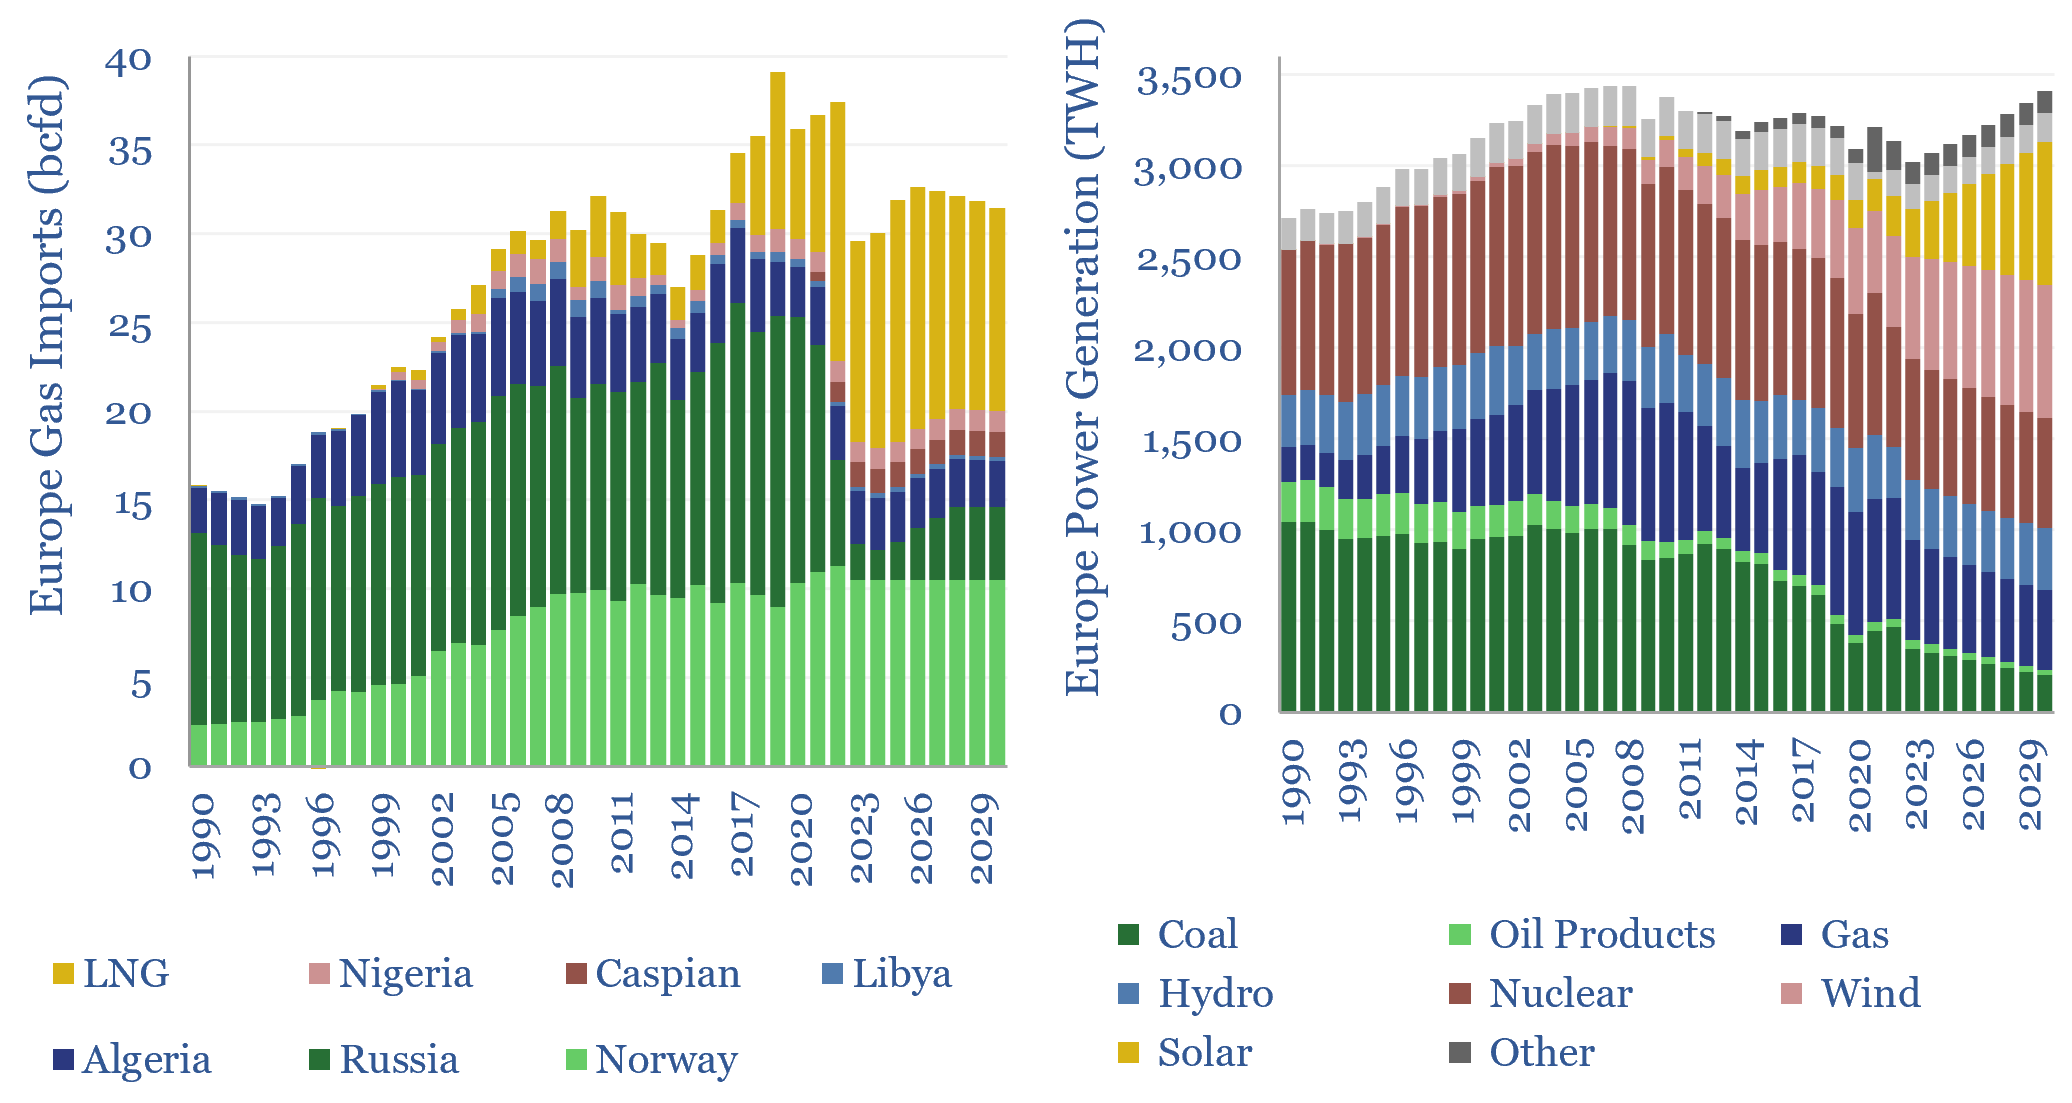
European gas and power markets will look better-supplied than they truly are in 2023-24. A dozen key input variables can be stress-tested in the data-file. Overall, we think Europe will need to source over 15bcfd of LNG through 2030, especially US LNG.
-
Oil markets: meltdown?
There is now a 75% chance of an oil rout in 2020, with prices falling to $20-40/bbl. Our updated Monte Carlo models, outlined in this 4-page report, reflect the demand destruction due to COVID19 and the breakdown of OPEC’s accord. The range of uncertainties is vast, c5x higher than at YE19. But our base case…
-
Upstream technology leaders: weathering the downturn?
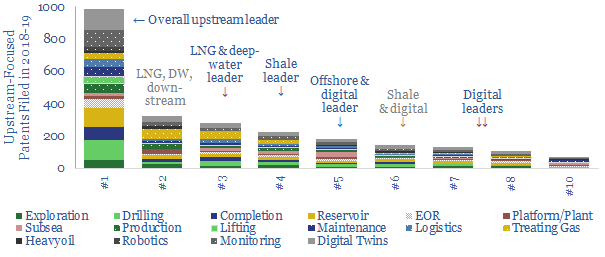
Leading technologies correlate 50-80% with ROACEs and -88% with costs in the energy industry. Hence, we assessed 6,000 patents from 2018-19, to determine which Energy Majors are best-placed to weather the downturn, benefit from dislocation and thrive in the recovery. We find clear leaders in onshore, offshore, shale, LNG and digital.
Content by Category
- Batteries (89)
- Biofuels (44)
- Carbon Intensity (49)
- CCS (63)
- CO2 Removals (9)
- Coal (38)
- Company Diligence (95)
- Data Models (840)
- Decarbonization (160)
- Demand (110)
- Digital (60)
- Downstream (44)
- Economic Model (205)
- Energy Efficiency (75)
- Hydrogen (63)
- Industry Data (279)
- LNG (48)
- Materials (82)
- Metals (80)
- Midstream (43)
- Natural Gas (149)
- Nature (76)
- Nuclear (23)
- Oil (164)
- Patents (38)
- Plastics (44)
- Power Grids (131)
- Renewables (149)
- Screen (117)
- Semiconductors (32)
- Shale (51)
- Solar (68)
- Supply-Demand (45)
- Vehicles (90)
- Wind (44)
- Written Research (356)