Search results for: “small scale LNG”
-
Energy transition: ten positive themes?
It can feel gloomy, forecasting 2-6% global energy shortages, bottlenecks on material value chains that must scale by 3-30x, and even fearing that global conflicts will volatilize commodity prices. Yet there are ten themes that particularly excite us, presented here, from faster technology progress, to world-changing efficiency technologies and a new age of ‘advanced materials’.
-
CCS absorbers: unit sizing and residence times?
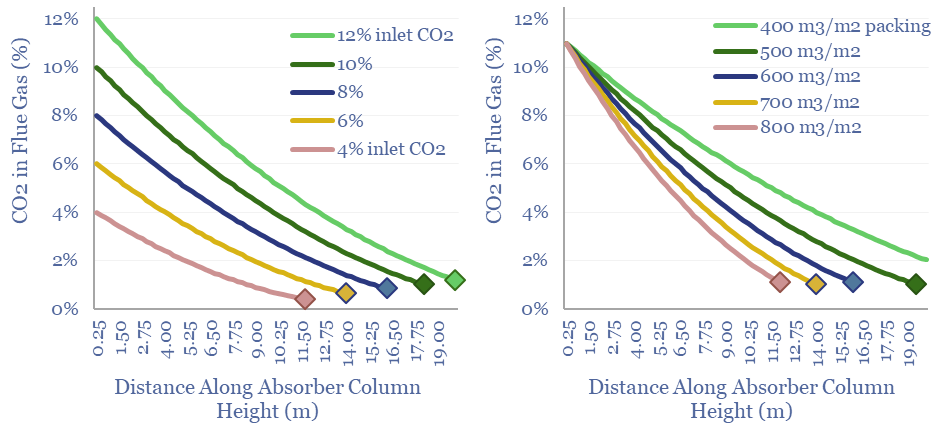
Post-combustion CCS plants flow CO2 into an absorber unit, where it will react with a solvent, usually a cocktail of amines. This data-file quantifies operating parameters for CCS absorbers, such as their sizes, residency times, inlet temperatures, structural packings and the implications for retro-fitting CCS at pre-existing power plants.
-
Redox flow batteries: for the duration?
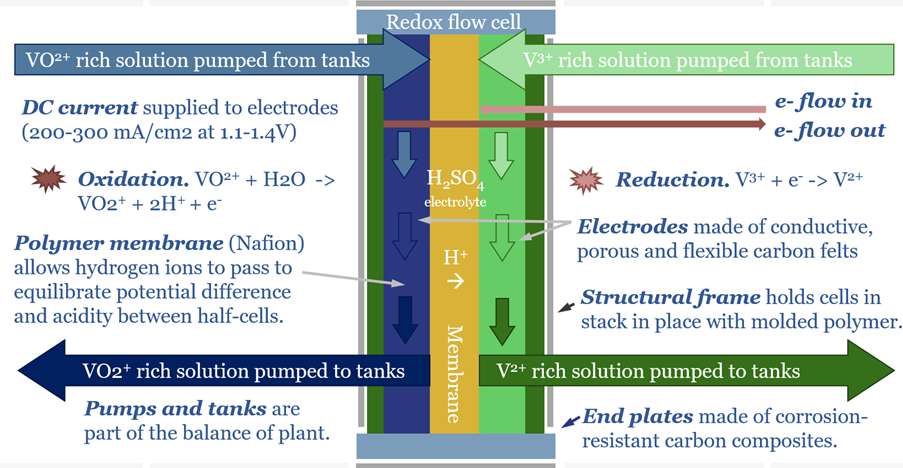
Redox flow batteries have 6-24 hour durations and require 15-20c/kWh storage spreads. They will increasingly compete with lithium ion batteries in grid-scale storage. Does this unlock a step-change for peak renewables penetration? Or create 3-30x upside for total global Vanadium demand? This 15-page note is our outlook for redox flow batteries.
-
Thermal energy storage: leading companies?
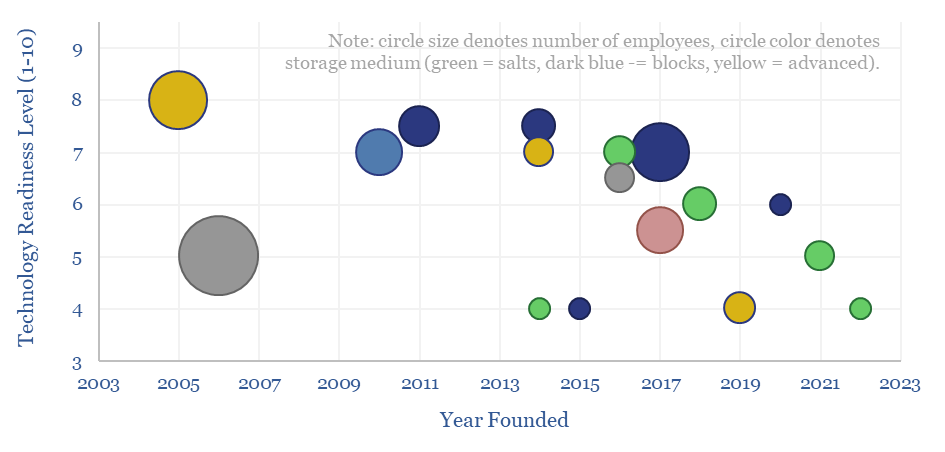
This data-file is a screen of thermal energy storage companies, developing systems that can absorb excess renewable electricity, heat up a storage medium, and then re-release the heat later, for example as high-grade steam or electricity. The space is fast-evolving and competitive, with 17 leading companies progressing different solutions.
-
Wind and solar: what CO2 abatement costs of renewables?
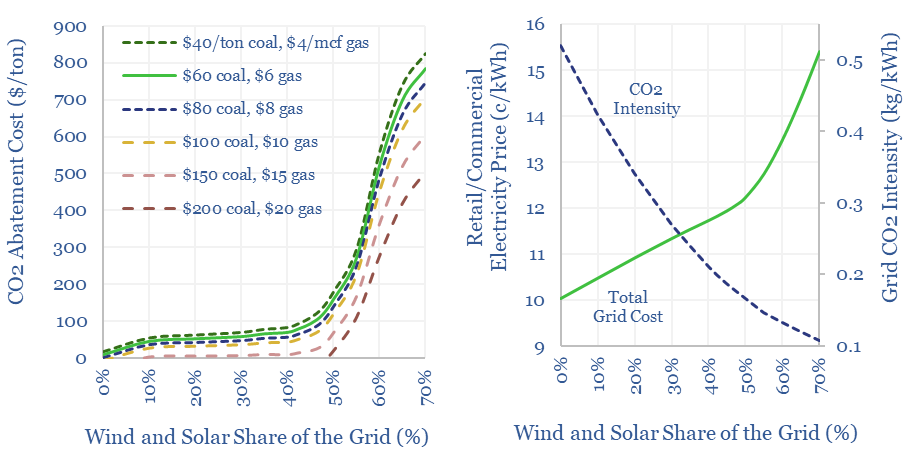
The costs of decarbonizing by ramping up solar and wind are highly dependent on context. The purpose of this data-file is to enable stress-testing of the CO2 abatement costs of renewables, in different contexts and at different grid penetrations. Our own estimate is that solar and wind can reach 40% of the global grid for…
-
BrightLoop: clean hydrogen breakthrough?
Is Babcock and Wilcox’s BrightLoop technology a game-changer for producing low-carbon hydrogen from solid fuels, while also releasing a pure stream of CO2 for CCS? Conclusions and deep-dive details are covered in this data-file, allowing us to guess at BrightLoop’s energy efficiency and a moat around Babcock’s reactor designs?
-
Generac: power generation products?
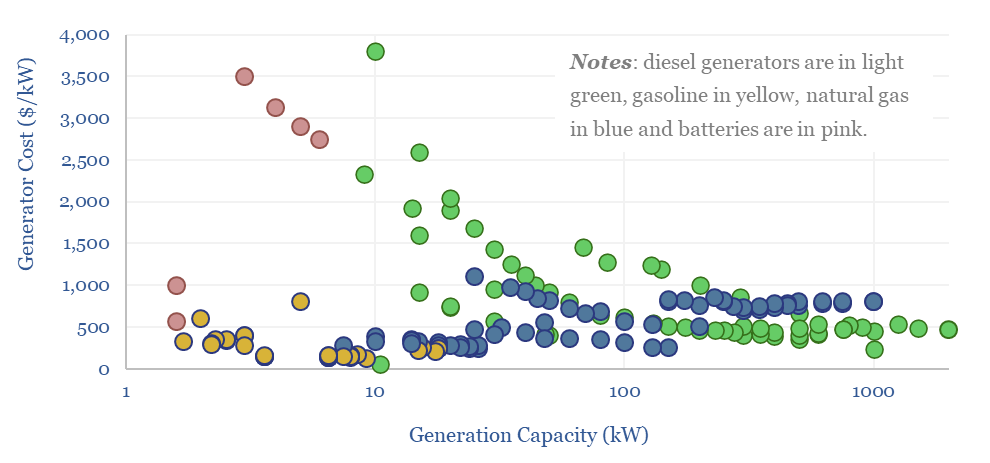
Generac is a US-specialist in residential- and commercial-scale power generation solutions, founded in 1959, headquartered in Wisconsin, with 8,800 employees and $7bn of market cap. What outlook amidst power grid bottlenecks? To answer this question, we have tabulated data on 250 Generac products.
-
Data-centers: the economics?
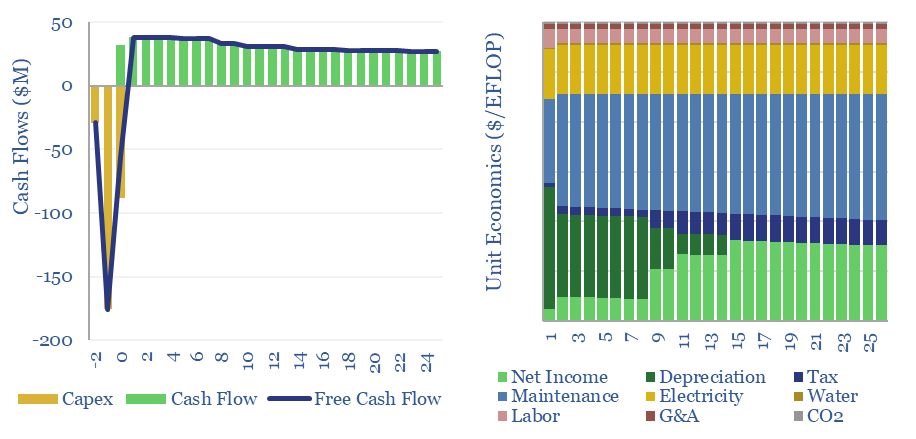
The capex costs of data-centers are typically $10M/MW, with opex costs dominated by maintenance (c40%), electricity (c15-25%), labor, water, G&A and other. A 30MW data-center must generate $100M of revenues for a 10% IRR, while an AI data-center in 2024 may need to charge $5/EFLOP of compute.
-
Bill of materials: electronic devices and data-centers?
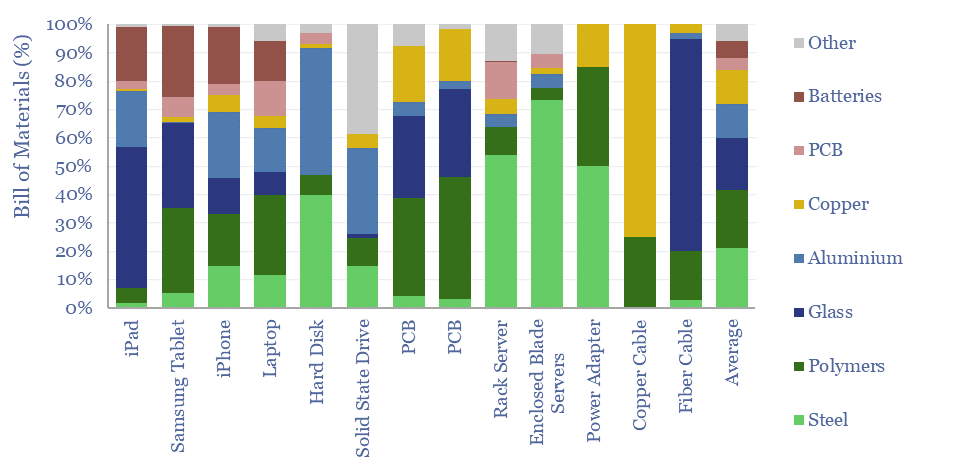
Electronic devices are changing the world, from portable electronics to AI data centers. Hence what materials are used in electronic devices, as percentage of mass, and in kg/kW terms? This data-file tabualates the bill of materials, for different devices, across different studies.
-
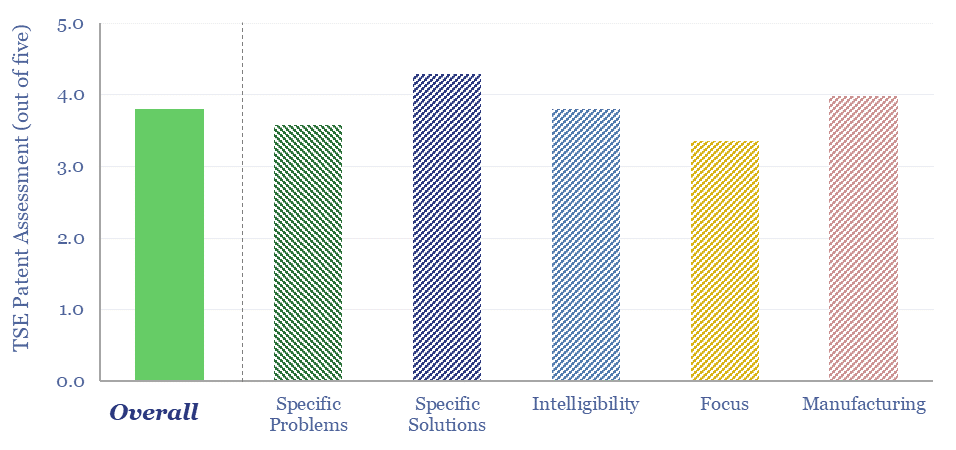
Cummins: diesel engine and generator technology?
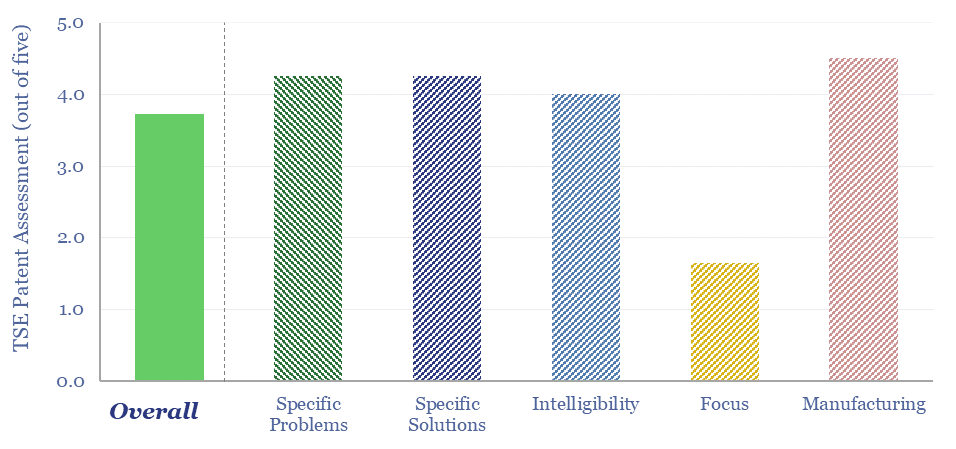
Cummins is a power technology company, listed in the US, specializing in diesel engines, underlying components, exhaust gas after-treatment, diesel power generation and pivoting towards hydrogen. We reviewed 80 patents from 2023-24. What outlook for Cummins technology and verticals in the energy transition?
Content by Category
- Batteries (89)
- Biofuels (44)
- Carbon Intensity (49)
- CCS (63)
- CO2 Removals (9)
- Coal (38)
- Company Diligence (95)
- Data Models (840)
- Decarbonization (160)
- Demand (110)
- Digital (60)
- Downstream (44)
- Economic Model (205)
- Energy Efficiency (75)
- Hydrogen (63)
- Industry Data (279)
- LNG (48)
- Materials (82)
- Metals (80)
- Midstream (43)
- Natural Gas (149)
- Nature (76)
- Nuclear (23)
- Oil (164)
- Patents (38)
- Plastics (44)
- Power Grids (130)
- Renewables (149)
- Screen (117)
- Semiconductors (32)
- Shale (51)
- Solar (68)
- Supply-Demand (45)
- Vehicles (90)
- Wind (44)
- Written Research (354)