East to West: re-shoring the energy transition?

re-shoring the energy transition

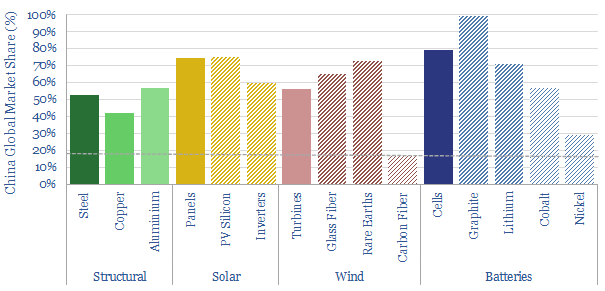
China is 18% of the worldโ€™s people and GDP. But it makes c50% of the worldโ€™s metals, 60% of its wind turbines, 70% of its solar panels and 80% of its lithium ion batteries. Re-shoring the energy transition will likely be a growing motivation after events of 2022. This 14-page note explores resultant opportunities.


World events in 2022 have created a new appetite for self-reliance; avoiding excessive dependence upon particular suppliers, in case that relationship should sour in the future. China’s exports are 5x Russia’s. And it dominates supply chains that matter for the energy transition. The trends and market shares are quantified on pages 2-4.

There are five challenges that must be overcome, in order to re-shore value chains from China to the West: input materials, energy costs, 2-3 re-inflation risks, dumping and general Western NIMBY-ism. We outline each challenge on pages 5-6.

Re-shoring the energy transition and its best opportunities are summarized, looking across all of our research, for metals and materials (page 7), wind (page 8), solar (page 9) and batteries (pages 10-11). In each case, where would be the most logical to site the infrastructure, and which companies are involved?

An unexpected implication of re-shoring these value chains is that their underlying energy demand would be re-shored too. Our current base case is that Western energy demand per capita has peaked and Western oil demand is in absolute decline. These markets may be re-shaped, with resultant opportunities for infrastructure investors (pages 12-14).

For an outlook on Chinaโ€™s coal industry and how we compare Chinese coal companies to Western companies, please see our article here.

Graphite: upgrade to premium?

Graphite opportunity in energy transition

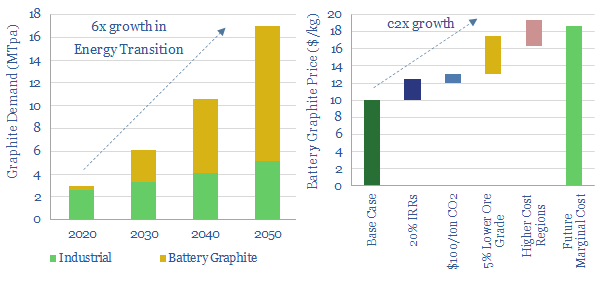
Global graphite volumes grow 6x in the energy transition, mostly driven by electric vehicles, while marginal pricing also doubles. We see the industry moving away from Chinaโ€™s near-exclusive control. The future favors a handful of Western producers, integrated from mine to anode, with CO2 intensity below 10kg/kg. This 10-page note on graphite opportunity in energy transition concisely outlines the opportunity.


What is graphite and why does it matter? We outline some history, some chemistry, some market-sizing and the main sources of industrial demand growth on pages 2-3.

The supply chain is explained on page 4-5. Specifically, how is battery-grade graphite made via mined graphite (natural route) and petcoke/coal (synthetic route), and what are the respective CO2 intensities?

Our base case economic model requires $10/kg for a greenfield production facility to earn a 10% IRR. We outline what drives these numbers on pages 6-7.

Surprise bottlenecks? We cannot help wondering whether there is a surprise bottleneck waiting in battery-grade graphite. The rationale is laid out on page 8.

Western companies are described on pages 9-10, including summary profiles of the four leading listed companies, ramping up Western graphite facilities in 2022-25.

To read more about our outlook on graphite opportunity in energy transition, please see our article here.
Back-stopping renewables: the nuclear option?

Nuclear power can backstop renewables

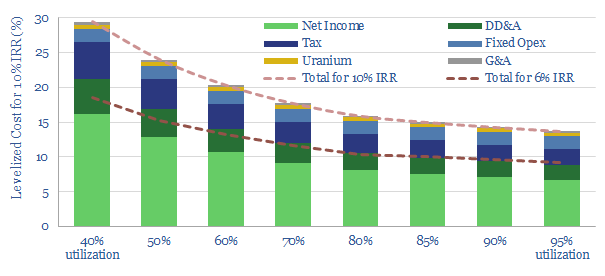
Nuclear power can backstop much volatility in renewable-heavy grids, for costs of 15-25c/kWh. This is at least 70% less costly than large batteries or green hydrogen, but could see less wind and solar developed overall. This 13-page note reviews how flexibility in nuclear power can backstop renewables, and sees nuclear growth accelerating.


Four types of volatility in renewable-heavy grids are described on page 2 and will require a back-up.

There are limitations for batteries in hydrogen, in smoothing this volatility, as discussed on pages 3-4.

What about nuclear? An improving economic rationale is noted on pages 5-6, prompting us to re-visit the possibility of flexible nuclear plant operation.

Technical issues for maneuvering large nuclear power plants, scaling their output up and down, are laid out from first principles on pages 7-11, including minute-by-minute ramp-rates and the largest challenge, which is cold-starts.

The economics of nuclear flexibility are calculated on page 12, showing costs around 15-25c/kWh for a new Western greenfield facility, which is less than large batteries and hydrogen.

Our conclusions around how nuclear power can backstop renewables volatility – and who benefits – are summarized on page 13.

Solid state batteries: will they change the world?

Quantumscape solid state battery costs

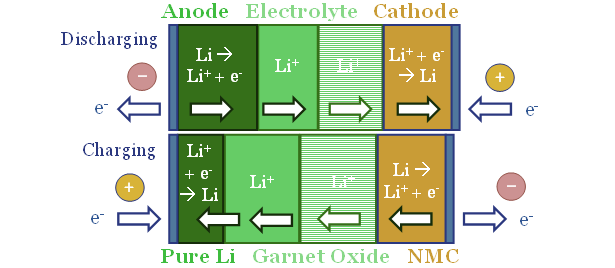
Solid state batteries promise 2x higher energy density than traditional lithium ion, with 3x faster charging and lower risk of fires. Thus they could re-shape global energy, especially heavy trucks. But the industry has been marooned by uncontrollable cell degradation. QuantumScapeโ€™s disclosures suggest it is light years ahead. Many of its claims are supported by patents. But costs may remain high. These are the conclusions in our new 20-page report.


Solid state battery technology is explained on pages 2-4, enabling the replacement of graphite anodes in conventional lithium ion batteries with pure lithium anodes, which have 10x higher charge density.

How would this change the energy industry? Our conclusions are spelled out on pages 5-11, covering electric vehicles, consumer electronics, heavy trucks, aviation, drones, other futuristic sci-fi concepts (!) and oil markets.

Technical challenges remain. Pages 12-14 outline our “top five issues”, based on reviewing over a dozen technical papers that were published in the past year.

The costs and CO2 intensities of solid-state batteries are going to be crucial. We have estimated both on pages 15-18, starting with our models of conventional lithium ion batteries, then adapting the numbers.

Has Quantumscape cracked the code? To answer this question, we reviewed 25 of the company’s patents from 2019-20. The positive is a focus on manufacturing methods, to meet 2023-24 commerciality targets. But we also draw conclusions on the avoidance of dendrites, proprietary catholytes and manufacturing costs.

Shifting demand: can renewables reach 50% of grids?

Shifting demand for wind and solar

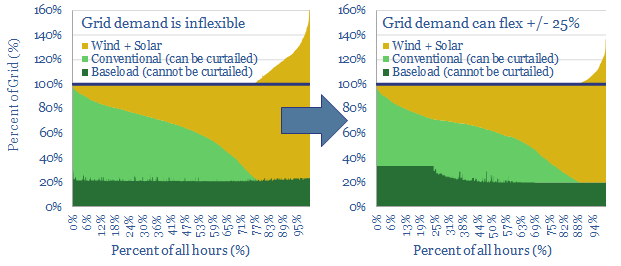
25% of the power grid could realistically become โ€˜flexibleโ€™, shifting its demand across days, even weeks. This is the lowest cost and most thermodynamically efficient route to fit more wind and solar into power grids. We are upgrading our renewables ceilings from 40% to 50%. This 22-page note outlines the growing opportunity in demand shifting.


Renewables would struggle to reach 50% penetration of today’s grids, due to their volatility. Pages 2-7 quantify the challenges, which include capacity payments for non-renewable back-ups, negative power pricing >20% of the time, >10% curtailment and 30% marginal cost re-inflation for new projects.

But a greater share of renewables would help decarbonization. This objective is explained on page 8, showing the relative costs and CO2-intensities of electricity technologies.

Renewable electricity storage is not the solution. It is costly and thermodynamically inefficient, which actually dilutes the impact of renewables. Costs and efficiency losses are quantified for batteries and for hydrogen on pages 9-11.

Demand shifting is a vastly superior solution. Pages 12-17 outline half-a-dozen demand-shifting opportunities that have been profiled in our research to-date. Companies in the smart energy supply chain are also noted and screened.

What impacts? We model that up to 25% of the grid can ultimately be demand-flexible, while this can help accommodate an additional 10pp share for renewables in the grid, before extreme volatility begins to bite (see pages 18-19).

Europe leads, and we now assume renewables can reach 50% of its power grid by 2050, with follow-through consequences for our gas and power models (page 20).

Our global renewables forecasts are not upgraded, as the bottleneck on a global basis is simply annual capacity additions, which must treble between 2020 and 2050, in our roadmap to ‘net zero’. (pages 21-22).

Vertical greenhouses: what future in the transition?

Vertical greenhouses in the energy transition

Vertical greenhouses achieve 10-400x greater yields per acre than field-growing, by stacking layers of plants indoors, and illuminating each layer with LEDs. Economics are exciting. CO2 intensity varies. But it can be carbon-negative in principle. This 17-page case study illustrates how supply chains are localizing and more renewables can be integrated into grids.


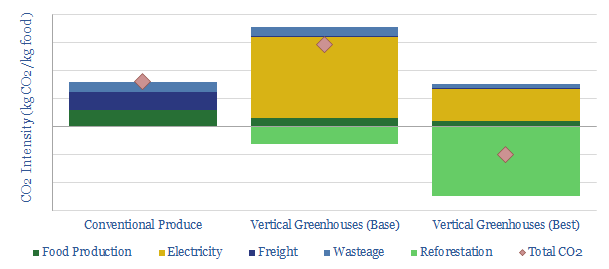
The first rationale for vertical greenhouses is to grow food closer to the consumer, which can save 0.6kg of trucking CO2 per kg of food. Eliminating freight is much simpler than decarbonizing freight (pages 2-4).

The second rationale for vertical greenhouses is that they are 10-400x more productive per unit of land, hence they can free up farmland for reforestation projects that absorb CO2 from the atmosphere (pages 5-6).

The third rationale for vertical greenhouses is that their LED lighting demands are flexible, which means they can absorb excess wind and solar, in grids that are increasingly laden with renewables. They are much more economical at achieving this feat than batteries or hydrogen electrolysers (pages 7-10).

The overall CO2 intensity of vertical greenhouses depends on the underlying grid’s CO2 intensity, but the process can in principle become carbon negative (pages 11-13).

Interestingly, we also think vertical greenhouses can smooth our volatile power grids by demand shifting.

The economics are exciting. We model 10% IRRs selling fresh produce at competitive prices, with upside to 30% IRRs if fresher produce earns a premium or operations can be powered with low-cost renewables when the grid is over-saturated (pages 14-15).

Leading companies in vertical greenhouses and in their supply chain are discussed on pages 16-17.

Energy transition: is it becoming a bubble?

Energy transition becoming a bubble?

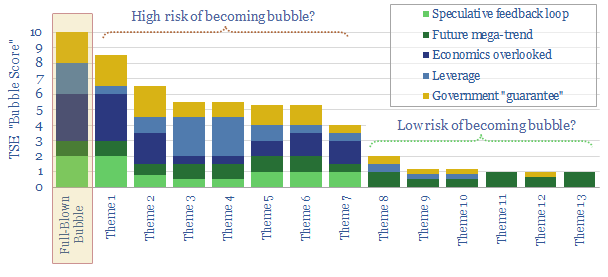
Investment bubbles in history typically take 4-years to build and 2-years to burst, as asset prices rise c815% then collapse by 75%. In the aftermath, finances and reputations are both destroyed. There is now a frightening resemblance between energy transition technologies and prior investment bubbles. This 19-page note aims to pinpoint the risks and help you defray them.


Our rationale for comparing energy transition to prior investment bubbles is contextualized on page 2, based on discussions we have had with investors and companies in 2020.

Half-a-dozen historical bubbles are summarized on pages 3-4, in order to compare the energy transition with features of Dutch tulips, the South Sea and Mississippi Companies, British Railway Mania, Roaring Twenties, Dot Com bubble and sub-prime mortgages.

Five common features of all bubbles are considered in turn on pages 5-16. In each case, we explain how the feature contributed to past bubbles, and where there is evidence of the feature in different energy transition technologies.

Important findings are that many themes of the energy transition can achieve continued deflation or profitability, but not both; while a combination of increasing leverage and curtailment on renewables assets could leave many assets underwater.

Implications are drawn out on pages 17-19, including five recommendations for decision-makers to find opportunities and avoid the most dangerous aspects of bubbles surrounding the energy transition.

Backstopping renewables: cold storage beats battery storage?

Phase change materials for backstopping renewables

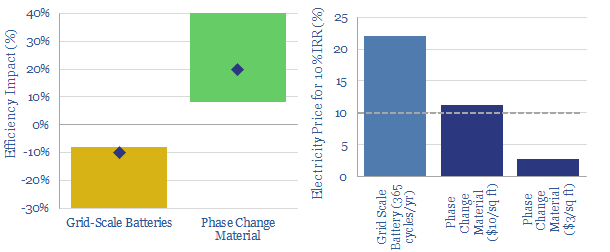
Phase change materials could be a game-changer for energy storage. They absorb (and release) coldness when they freeze (and melt). They can earn double digit IRRs unlocking c20% efficiency gains in freezers and refrigerators, which make up 9% of US electricity. This is superior to batteries which add costs and incur 8-30% efficiency losses. We review 5,800 patents and identify early-stage companies geared to the theme in our new 14-page note.


Refrigerators and freezers comprise 9% of the US electric grid, of which half is in the commercial sector, across 4,200 warehouses, 40,000 supermarkets and 620,000 restaurants. This report argues that a new class of materials, Phase Change Materials (PCMs), can effectively store excess renewable energy as coldness in these fridges and freezers (aka “demand shifting“), improving their efficiency by c20% and without requiring power prices to increase.

The energy economics of cold storage are explained on pages 2-4, outlining the energy consumption of cold storage facilities as function of different input variables (which will also help you understand how to save energy at your fridge-freezer at home) .

Phase change materials are explained on pages 5-6, explaining what they are, how they work, and how they can lower energy consumption by c20% at a typical fridge/freezer.

The economics are modelled on pages 7-8, showing an 8.5% IRR under recent costs and power prices, rising into double digits with a CO2 price, and above 30% with recent deflation in the costs of PCMs.

A comparison with battery storage is provided on page 9-10, showing a clear preference for PCMs. Batteries decrease efficiency and raise electricity costs. PCMs increase efficiency and do not raise electricity costs. Batteries have further challenges.

Who are the leading companies commercialising PCMs? We answer this question on pages 11-14, by reviewing 5,800 patents. We find promising venture-stage and growth-stage companies in the space, plus listed companies in the capital goods, materials and automotive sectors.

Ten Themes for Energy in the 2020s

We presented our ‘Top Ten Themes for Energy in the 2020s’ to an audience at Yale SOM, in February-2020. The audio recording is available below. The slides are available to TSE clients, in order to follow along with the presentation.


Please sign up to our distribution list, to receive our best ideas going forwards…

=

Decarbonized power: how much wind and solar fit the optimal grid?

when will wind and solar peak?

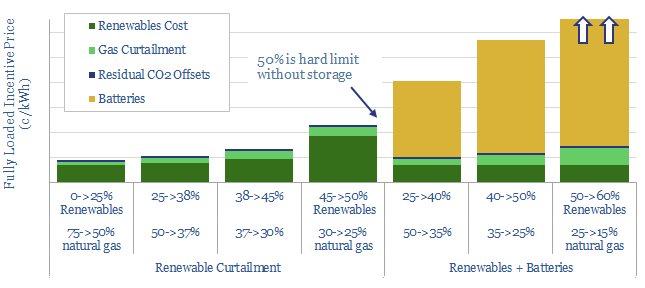
What should future power grids look like? Our 24-page note optimizes cost, resiliency and CO2, using a Monte Carlo model. Renewables should not surpass 45-50%. By this point, over 70% of new wind and solar will fail to dispatch, while incentive prices will have trebled. Batteries help little. They raise power prices by a further 2-5x to accommodate just 3-15% more renewables. The lowest-cost, zero-carbon power grid, we find, comprises c25% renewables, c25% nuclear and c50% decarbonized gas, with an incentive price of 9c/kWh.


Pages 2-4 illustrate the volatility of wind and solar generation at today’s grid penetration, providing rules of thumb around intermittency.

Pages 5-6 illustrate the strange consequences once renewables surpass 25% of the grid, including curtailment, negative power pricing and financing difficulties.

Pages 7-9 quantify and explain how much curtailment will take place in a typical grid as renewables scale from 25% to 40%, 50% and 60% of gross generation, using a Monte Carlo approach. The model shows when and why curtailment is occurring.

Pages 10-20 quantify and explain the costs of batteries, to backstop renewables as they scale from 25%, to 40%, 50% and 60% of the grid, while avoiding curtailment. Real world conditions are not conducive to competitive battery economics.

Pages 21-23 quantify the residual reliance on natural gas. Amazingly, even our most aggressive battery scenarios only permit 10% of gas-power capacity to be shuttered. Low-utilization gas is costly. High-utilization gas is less costly. And the economics of decarbonized gas are superior to any renewables plus batteries combination.

Page 24 concludes that natural gas will emerge as the ‘best battery’ to backstop renewables, estimating the most likely shares in an optimal power mix.

Copyright: Thunder Said Energy, 2019-2024.