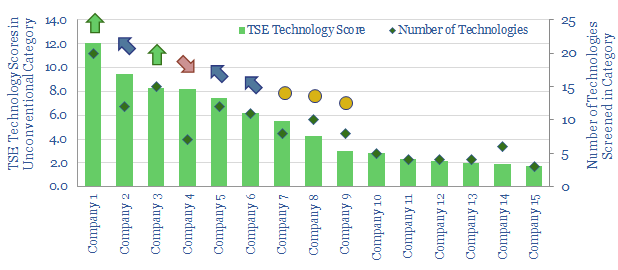
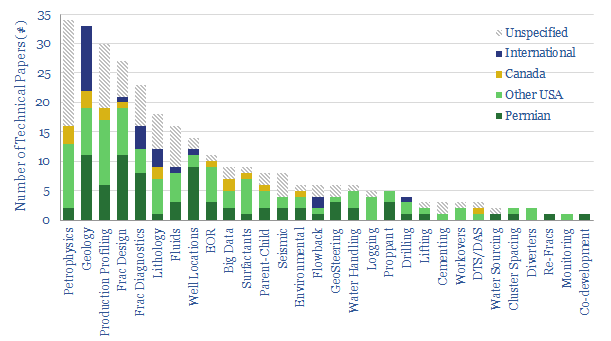
US shale: the quick and the dead?

Top US shale companies

It is no longer possible to compete in the US shale industry without leading digital technologies. This 10-page note outlines best practices, process by process, based on 500 patents and 650 technical papers. Chevron, Conoco and ExxonMobil lead our screens. We profile where they have an edge, to capture upside in the industry’s dislocation and recovery. Disconcertingly absent from the leader-board is EOG, whose long-revered technical edge may now have been eclipsed by others.

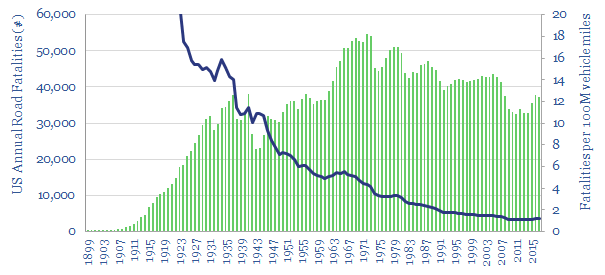
More dangerous than coronavirus? The safety case for digital and remote operations.

safety case for digital and remote operations

Remote working, digital de-manning, drones and robotics — all of these themes will structurally accelerate in the aftermath of the COVID crisis. Our research outlines their economics and how they can accelerate the energy transition. But this short note considers the safety consequences. They are as significant as COVID itself. And equally worthy of re-casting behaviours, policies and investments.


At the time of writing, the United States has been hardest hit by the COVID crisis out of any country in the world. It has incurred c35,000 fatalities. However, in the past five years, the US has also incurred an average of 35,000 fatalities on its roads each year (below). This is c100 deaths per day. 1 out of every 10,000 people is killed on US roads each year. There are 1.2 death for every 100M vehicle miles driven (and 3.2 trn miles are driven each year).

Likewise, at the time of writing, the US has been hit by 700,000 COVID cases. For comparison, there are 2.6M injuries on US roads each year, and 6.3M traffic accidents. This means 1 out of every 125 people is injured on US roads each year. There are 83 injuries for every 100M vehicle miles driven.

If you believe in working from home to save lives amidst the coronavirus crisis, a similar argument may justify working from home, where possible.

In addition, 5,250 US workers were killed in workplace fatalities in the most recent annual data, equivalent to 1 out of every c30,000 full-time employees. 40% of these deaths occur on roads. Of all the major job categories shown below, the most dangerous is trucking, where 1 out of every 4,000 full-time employees is killed each year.

Looking more granularly, COVID has so far killed 1 out of every 10,000 people in the United States. However, fatality rates range from 1 in 10,000 to 1 in 1,000 for workers in some of the more physically intensive industries (as shown below), which comprise 10% of all the hours worked around the US economy.

Workplace injury rates are 3% across the entire US economy. This is also 10x higher than the number of documented COVID cases so far in the United States.

If you believe in using technology to save lives amidst the coronavirus crisis, a similar argument may justifying greater deployment of autonomous technologies, digital de-manning, drones and droids, across the broader US labor market.

Our research finds that 48% of recent digitization initiatives have materially improved safety (chart below). 60% also materially lowered costs, 55% materially increased output and 24% materially lowered CO2 emissions.

To recycle an example from the note, there is no need for a worker to be placed into harm’s way — climbing a scaffold to inspect a roof or lowered on a harness to inspect the undersides of an oil platform — as remote monitoring, drone and robotics technologies become available. This is why we have recently screened which operators are among the technology leaders, including in digital technologies (chart below).

The importance of remote work, digitization technologies and robotics may sound obvious when framed in the terms above. But they are not being deployed sufficiently. The chart below shows the number of road fatalities in the US, declining at a 3.4% CAGR since 1920. But there has been no progress in the past ten years since 2009. The absolute count of road fatalities in the latest data is no better than in 1960 (below).

Likewise, workplace fatality rates deflated at 3% pa since 1992, but they have also since stalled. No net improvement has occurred since 2009.

Safety matters, during the COVID-crisis, and after the COVID crisis. Remote and digital technologies can play an enormous role, if enabled by policies and embraced by forward-thinking companies. Please contact us if we can help you screen opportunities. And sorry for the morbid tone of this short note.

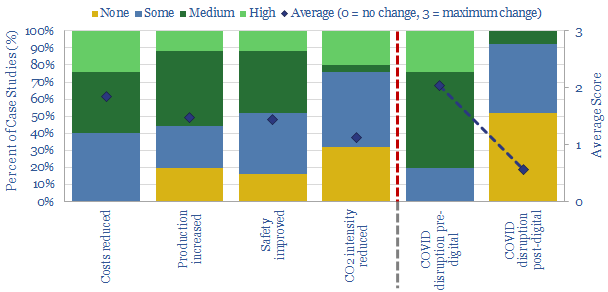
Digitization after the crisis: who benefits and how much?

Digitization after COVID-19 crisis who benefits how much

Digitization offers superior economics and CO2 credentials. But now it will structurally accelerate due to higher resiliency: Just 8% of digitized industrial processes will be materially disrupted due to COVID-19, compared to 80% of non-digitized processes. In this 22-page research report, we have constructed a database of digitization case studies around the energy industry: to quantify the benefits, screen the most digital operators and identify longer-term winners from the supply chain.


Pages 2 outlines our database of case studies into digitization around the energy industry.

Page 3 quantifies the percentage of the case studies that reduce costs, increase production, improve safety and lower CO2.

Pages 4-6 show how digitization will improve resiliency by 10x during the COVID-crisis, stoking further ascent of energy industry digitization.

Page 7 generalizes to other industries, arguing digitization will accelerate the theme of remote working, esepcially in physical manufacturing sectors.

Pages 8-9 screen for digital leaders among the 25 largest energy companies in the world, based on our assessment of their patents, technical papers and public disclosures.

Pages 10-11 identify leading companies from the supply chain, which may benefit from the acceleration of industrial digitization; again based on patents and technical papers.

Pages 12-22 present the full details of the digitization case studies that featured in our database, highlighting the best examples, key numbers and leading companies; plus links to delve deeper, via our other research, data and models.

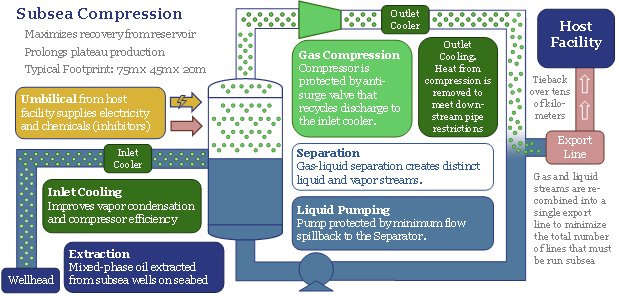
The future of offshore: fully subsea?

Fully Subsea Solutions

Offshore developments will change dramatically in the 2020s, eliminating new production platforms in favour of fully subsea solutions. The opportunity can increase a typical project’s NPV by 50%, reduce its breakeven by one-third and effectively eliminate upstream CO2 emissions. We have reviewed 1,850 patents to find the best-placed operators and service providers, versus others that will be disrupted. Overall, the theme supports the ascent of low-carbon natural gas, which should treble in the energy mix by 2050. This 22-page note presents the opportunity.


The offshore oil and gas industry’s progress towards ‘fully subsea’ developments, without any platforms or surface infrastructure being necessary, is reviewed in detail in pages 2-5, covering key projects and milestones from 1985-2000.

30% economic savings in both capex and opex are quantified line-by-line, across c50 cost lines, in pages 6-9.

1.5x NPV uplifts and 4pp IRR uplifts are quantified by modelling a representative fully greenfield gas-condensate project on pages 11-12.

CO2 emissions can be virtually eliminated by a fully subsea development solution. Pages 12-13 add up the impacts of higher efficiency, power from shore, fewer materials and the elimination of PSV/helicopter trips.

The key engineering challenges for fully subsea systems, which remain to be resolved, are summarized on page 14.

Who benefits from the trend toward fully subsea systems, is described from page 15 onwards after reviewing 1,850 patents around the industry. This includes both the leading service companies and operators (primarily Equinor, but also TOTAL, Shell).

The leaders in subsea compression technology are assessed on pages 16-17.

The leaders in subsea power systems are described on pages 18-19.

The leaders in next-generation subsea robotics are assessed on pages 20-21.

Others are disrupted, as is described in detail in page 22.

Covered service companies in the report include ABB, Aker, Eelume, GE, Kraken, Oceaneering, OneSubsea, Saipem, Siemens, Technip-FMC, Wood Group, the PSV and helicopter sector, and c20 early stage companies in next-generating subsea robotics.

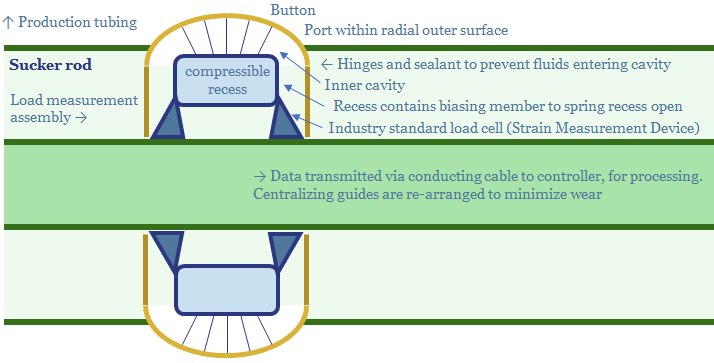
EOG’s Digitization: Pumped-Up?

EOG's digitization patent

EOG patented a new digital technology in 2019: a load assembly which can be built into its rod pumps: to raise efficiency, lower costs and lower energy consumption. This 8-page note reviews the patent, illustrating how EOG is working to further digitize its processes, maximise productivity and minimise CO2 intensity.


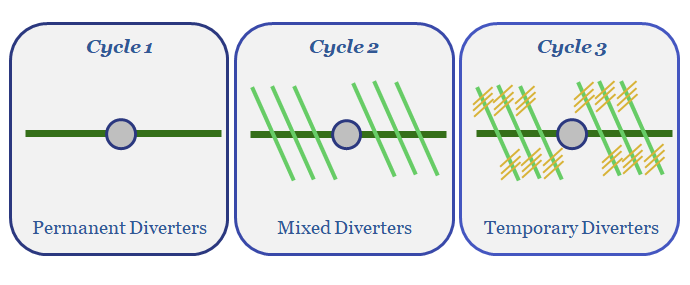
New Diverter Regimes for Dendritic Frac Geometries?

BP Fracturing Fluid Diverters for Shale Productivity

The key challenge for the US shale industry is to continue improving productivity per well, as illustrated repeatedly in our research. Hence, this short note reviews an advance in fracturing fluids, which has been patented by BP. Diverter compositions are optimised across successive pressurization cycles, to create dendritic fracture geometries, which will enhance stimulated rock volumes.


[restrict]

BP has patented a novel regime of fracturing fluids, which can be deployed across multiple pressurization sequences in its shale completions. The first sequence contains permanent diverting agents, introduced to create bi-wing and large fractures, then flowed back. The second fluid contains temporary, near-field diverting agents, which will dissolve in situ, usually within 24-72 hours, to expand the fracture network. Similarly, the third fluid contains temporary, far-field diverting agents.

The purpose of this completion design is to create dendritic fracture geometries. The diverting agents prevent fracturing fluids from leaking into the formation, so that primary, then secondary, then tertiary fracture networks can be created independently, each improving reservoir fluid conductivity (chart below).

The approach is data-driven. The formation of new fractures, with increasingly dendritic geometries, can be inferred from a linear slope between instantaneous shut in pressures on successive pressurization cycles. The fracturing fluids’ composition is also said to be determined based on Instantaneous Shut in Pressures, in-situ stress calculations and flowback volumes.

The permanent diverting agents may comprise mesh proppant, walnut hulls, large grain size proppants or particulates, such as polylactic acid, benzoic acid flakes, rock salt, calcium carbonate pellets. Small mesh size is envisaged (40-70 to 100 mesh), with low concentrations (0-0.1 lb/gal) to mitigate the risk of screen-outs.

The temporary diverting agents are not specifically disclosed in the patent, but are intended to dissolve in response to temperature, salinity, pH or other parameters. They may be pumped alongside proppant or standalone.

The patent is increasing evidence that Oil Majors are now innovating at the cutting edge of shale, in order to drive productivities higher. For a review of which companies screen as having the most advanced shale technologies, from the patent literature, please see our recent note, Patent Leaders.

Source: Montgomery, R., Hines, C. & Reyna, A. (2018). Hydraulic Fracturing Systems and Methods. BP Patent US2018202274

[/restrict]

Please log in to view this content

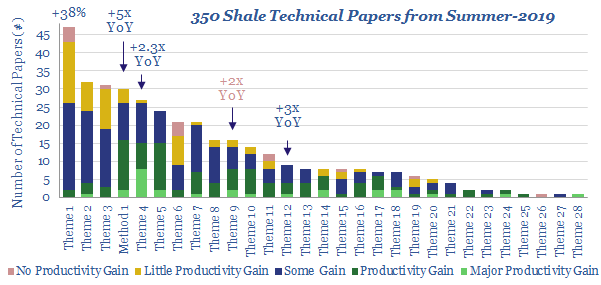
US Shale: No Country for Old Completion Designs

Shale productivity gains

2019 has evoked resource fears in the shale industry. They are unfounded. Even as headline productivity weakened, underlying productivity continues improving at an exciting pace. These conclusions are substantiated by reviewing 350 technical papers, published by the shale industry in summer-2019. Major improvements are gathering momentum, in shale-EOR, machine learning techniques, digitalization and frac fluid chemistry.


Discussed companies include Apache, BP, Conoco, Chevron, Devon, ExxonMobil, Halliburton, Occidental, Pioneeer & Schlumberger.

Page 2 compares 2019’s shale performance to-date with our January forecasts, identifying that initial-month producutivity has been 20% weaker YoY.

Page 3-4 shows how continued productivity improvements matter, to unlock >20Mbpd of potential US shale output, plus $300bn of FCF by 2025 (at $50/bbl oil).

Pages 5-8 explain away the apparent degradation in resource productivity: it is a function of three alterations to completion designs.

Pages 9-12 outline 350 technical papers from the shale industry in summer-2019. They restore confidence: the industry is not facing systemic resource issues.

Page 12 covers 24 technical papers into “parent-child” issues. We were surprised by the number that were ‘negative’ versus the pragmatic solutions offered in others.

Page 13, 14 & 17 cover leading digitalization technologies: deployment of machine learning increased 5x YoY, while DAS/DTS increased 3x YoY in 2019.

Pages 14-16 cover the maturation of shale-EOR, which was the greatest YoY improvement, reaching 32 papers in 2019. The cutting-edge of EOR is exciting.

Page 18 outlines other technical highlights to drive future productivity higher.

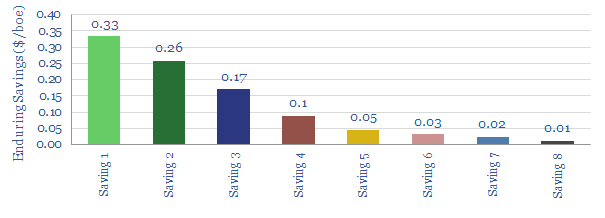
Digital Deflation: How Hard to Save $1/boe?

digital deflation

A typical offshore operator can very readily save $1/boe via continued, digital deflation; which is tantamount to $1bn per annum at a c3Mboed Oil Major.

Our numbers are derived from a case study by Cognite, which is among the leaders in oilfield digitization, collaborating with cutting-edge E&Ps, as described below.

Digitization remains the most promising opportunity to improve offshore economics. But the gains are granular and can only be seen by delving into the detail…


[restrict]

This short note will focus further upon three particular avenues for digital deflation, which collectively account for $0.6/boe of cost savings at a typical offshore operator.

All are achieved using greater data instrumentation, as highlighted in Cognite’s recent case study, based on working alongside Aker-BP, which we calculate can save $1/boe across the operator’s portfolio (chart below).

(1). Production Optimisation can be attained by increasing the throughputs in processing units, such as separators. In Cognite’s example, this is safely achieved by using better data from multi-phase flow-meters upstream of the processing units. Better data enables better performance. Deferrals associated with the flow-meter calibration are also reduced by 30-50%.

(2). Smart maintenance of equipment can be achieved by greater monitoring. For instance, the Ivar Aasen sends data back to shore, in real time, on 90,000 information packages, including 18,000 valves, all the wells, compressors, pumps and generators. Cognite’s example is at these shut-down valves and fire dampers, which now require 80% fewer maintenance hours to check. In addition, the number of hours per miantenance check is reduced by 90%.

(3). Improved information flow to “digital workers” improves productivity. As context, maintenance of a large process unit (e.g., a 1st stage separator) may require 1,300 planning hours per year, but this can be improved using data (video below). In turn, this superior planning reduced the time spent on routine inspections by c50%, increasing the number of monthly maintenance jobs by 10% and with better HSE performance.

A virtual visit to an offshore oil platform, instrumented by Cognite. Live data are displayed and can be further interrogated for planning purposes …

Digital improvements offer great potential to improve offshore economics. However, as we have highlighted, no individual improvement is a magic bullet. Uplifting IRRs, particularly on new greenfield projects by say, 5pp, requires progress on as many as twenty different dimensions (chart below).

This is where Thunder Said Energy can help, screening the economic opportunities and best-practices across different companies, using our databases of patents and technical papers.

[/restrict]

Please log in to view this content

U.S. Shale: Winner Takes All?

Permian shale technology

Shale is a ‘tech’ industry. The technology keeps improving at an incredible pace. But Permian technology is improving fastest, extending its lead over other basins.

These are our conclusions from assessing 300 technical papers across the shale industry in 2018. They are outlined in a new, 10-page note.


Across the board, we found 30% of our 300 technical papers should improve future economics. 60% were highly digital, and thus tended to be more impactful. Advanced analytics are still in an early innings.

Permian shale technology

The Permian stood out, extending its lead over other basins. It produced c25% of all the research; 25% higher-impact research and 40% more data-driven research.

Permian shale technology

Copyright: Thunder Said Energy, 2019-2024.