We argue CO2-labelling is the most important policy-measure that can be taken to accelerate the energy transition: making products’ CO2-intensities visible, so they can sway purchasing decisions. There is precedent to expect 4-8% savings across global energy use, which will lower the net global costs of decarbonisation by $200-400bn pa. Digital technologies also support wider eco-labelling compared with the past. Leading companies are preparing their businesses.
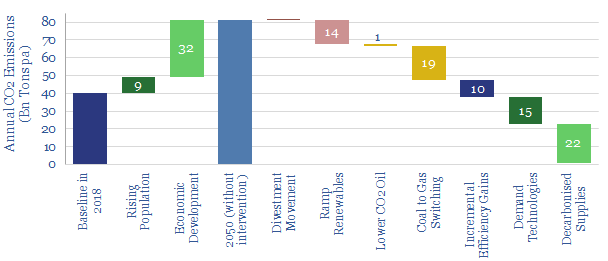
Faster Efficiency gains are critical to decarbonisation. We model it is possible to fully decarbonise the world’s energy system by 2050: c17% by ramping renewables, 26% by shifting to less CO2-intensive fossil fuels (which still grow in absolute terms to 2050), 27% through carbon capture initiatives and 30% through industrial efficiency gains and demand-side technologies, which get “more for less” (chart below). To repeat, the largest contributor to eliminating 2050’s CO2 is using energy more efficiently.
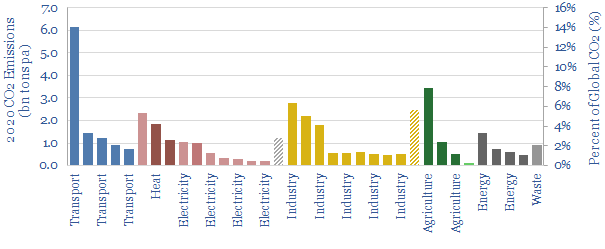
A problem: consumers currently have almost no idea whether they are consuming energy efficiently when making purchasing decisions. particularly in the food industry, which can comprise up to 30% of an individual’s carbon footprint, at 2.5T of CO2e pp pa (chart below, data here). One recent study in Nature found that 1000 consumers under-estimated the CO2 emissions of their dietary items by as much as 10x [1]. 59% of consumers confess being confused which foods count as sustainable.
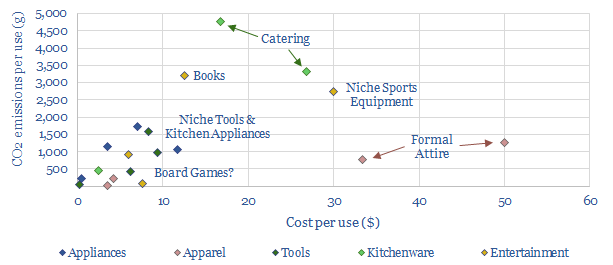
A few examples show how helpless we are at fore-knowing the carbon footprints of our purchases: How much more CO2 is there in 1kg of beef versus 1kg of vegetables? (the answer is a stark 13.5x, at 27kg vs 2kg). How about 1kg of cheese vs 1kg of milk (answer: 13.5kg vs 1.9kg). How about a typical book versus a typical tennis racquet? (answer: 6kg vs 3kg, chart below, data here). How about a “high CO2” versus a “low CO2” chocolate bar (6.5kg vs 0kg, as CO2-impact can vary 50x, within producers of the same product [2]). Is more CO2 saved by driving an electric car for a whole year or by forgoing a single Trans-Atlantic round-trip flight? (answer: both are around 2-3 tons). Are there any CO2-negative products for purchase? (there are, data here).
CO2 labelling must be a solution. If consumers are to favour lower carbon products, then knowledge is the first step. It is necessary to be able to compare and contrast products. This is “eco-labelling”: placing a label for the CO2 associated with each purchasing option. Ideally it is a numerical calculation, or more simply, a traffic-light (red, yellow, green) may be adopted.
Eco-Labelling in Practice: A Short History?
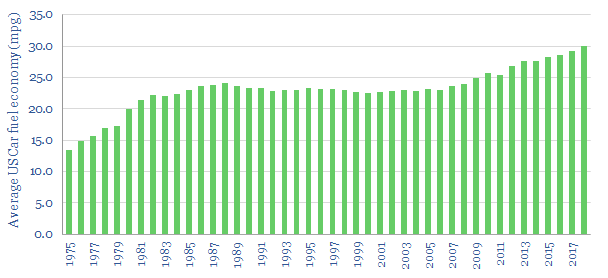
A precedent. CAFE standards for cars are the best-known, longest-running eco-labelling program. They go back to the 1973-4 oil crisis. Today, OEMs are required to use EPA-certified fuel economy test results and cannot advertise any other fuel economy metric for vehicles. Making fuel efficiency visible to consumers has been one driver behind the impressive 2% pa CAGR in US fuel economy (chart below).
Likewise, EU Ecolabels were established in 1992, to identify environmentally friendly products: at this time, 75% of fridges and freezers were rated as low efficiency (ratings D-G) while today, 98% are classed as highly efficient (ratings A++ or A+++), cutting their emissions by c7%. The label informs 85% of consumers’ purchasing decisions. What gets inspected by consumers is thus respected by suppliers.
Prior eco-labelling schemes have been attempted for broader consumer products, but the technology may not have been ready. The first supermarket carbon labelling program was implemented by Carbon Trust, in the UK, in 2006. It included Walkers Crisps, British Sugar and Quaker Oats. Tesco trialled carbon labels on milk, detergents, oranges and toilet paper in 2007, but the pilot was shelved in 2012, due to unforeseen costs and lack of take-up. Subsequent schemes have been trialed in Canada, Japan, Korea, Thailand, Switzerland, France, Finland and the US.
Digital technologies can help, making it easier to add up the CO2 associated with each input, at each successive stage of the supply chain, to yield a final estimate at the point of consumption. This will produce more precise estimates than in the past, which are more auditable and less expensive to compute.
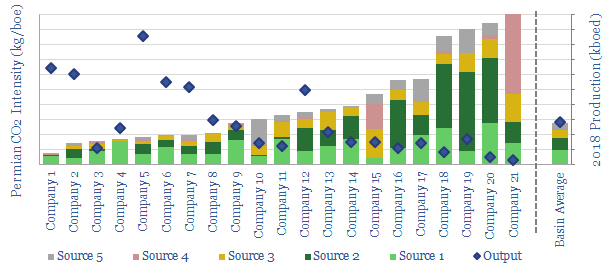
The US already has a toehold, through the EPA’s FLIGHT tool, which covers most industrial facilities and has a broad coverage. For example, it recently allowed us to decompose Permian producers’ total CO2-intensities (chart below, data here).
Technology companies are emerging to make further progress. As an example, Ecoingot is using a mobile phone-based scanner alongside app based on calculations, RFIDs and retailer data to make products’ CO2 visible to consumers. It is working with Whole Foods, Walgreens and CVS. Climate Neutral also launched in 2018, to help brands declare their intent to eliminate CO2 emissions in their products.
Policies could help further. One past challenge has been that disclosures are voluntary, which means lagging producers have no incentive to identify themselves. Policies for mandatory eco-labelling may change this. For example, Denmark has announced climate labelling on food products will accompany its plan to become carbon neutral by 2050: stickers will be placed on all food products to improve consumer choice. A petition is currently gathering signatures in Germany, lobbying for a similar requirement.
Consumers support it. A recent YouGov survey of 9,000 consumers, across seven countries, found 67% support for recognisable CO2 labelling on products. 66% of survey participants also say they would feel more positive about companies that can demonstrate they are making efforts to reduce carbon footprint of their products.
Companies support it. In December-2018, Carbon Trust estimated it was doing 40-50x more life-cycle CO2 analyses than a decade ago, particularly in the business-to-business category. Case studies on its website include BT, Carlsberg, Dyson, Evian, GSK, Howdens, Samsung, Vodafone et al. Pick one of these examples at random, and you learn that a Dyson Airblade hand-dryer is 80% more energy-efficient than the industry standard. It is not just in the oil industry that carbon credentials are set to impact capital costs.
What are the impacts on decarbonisation?
Impacts of Eco-Labelling? A Norwegian study has measured a 9% reduction in meat consumption, after adding traffic-light eco-labels in a University cafeteria [3]. Likewise, an Australian super-market found a 15% reduction in the sales of “black-labelled” goods and a 8% increase in green-labelled goods, after implementing its own pilot [4]. More ambitiously, Tesco and WWF have launched a campaign to cut the environment impact of the average UK shopping basket by 50%.
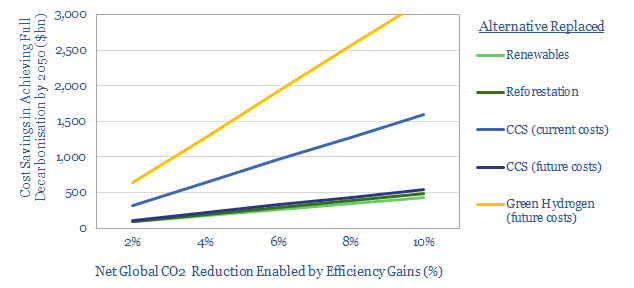
Costs of Decarbonisation could be lowered by c$200bn per annum in our base case scenario, where an c8% CO2 saving is achieved on 50% of products (chart below). Thus a lower reliance upon CCS or reforestation is required in our decarbonisation models. The savings could surpass $1trn per annum if the reliance is lowered on costly green hydrogen technologies, although these do not currently feature heavily in our decarbonisation models. Double the savings from eco-labelling, if the practice can drive a c8% efficiency gain through the entire energy system, and $400bn of annual savings are achieved.
We conclude one of the most critical policy challenges to drive the energy transition is to mandate broad CO2-labelling of products, so that consumers can begin selecting lower-CO2 items, where today’s visibility is woefully poor. In turn, this will reward companies that improve their emissions and disfavor those that do not. Decarbonisation will not be achieved by making the energy industry into a Waste Land, but by strengthening its efficiency.
References
[1] Camilleri, A., Larrick R. P., Hossain, S. & Patino-Echeverri, D. (2019). Consumers underestimate the emissions associated with food but are aided by labels. Nature.
[2] Poore, J. & Nemecek, T. (201). Reducing food’s environmental impacts through producers and Consumers. Science 360 (6392) 987-992,.
[3] Slapo, H. B. & Karevold, K. I. (2019). Simple Eco-Labels to Nudge Customers Toward the Most Environmentally Friendly Warm Dishes: An Empirical Study in a Cafeteria Setting.
[4] Vanclay, J.K., J. Shortiss, S. Auselbrook, A.M. Gillespie, B.C. Howell, R. Johanni, M.J. Maher, K.M. Mitchell, M.D. Stewart, and J. Yates. 2011. Customer Response to Carbon Labelling of Groceries. Journal of Consumer Policy 34: 153–160.