The volatility of solar generation is evaluated in this case study, by tracking the output from a 275MW solar project, at 5-minute intervals, throughout an entire calendar year. Output is -65% lower in winter than summer, varies +/-10% each day, and +/- 5% every 5-minutes, including steep power drops that in turn require back-ups.
Darlington Point is a 333MW-dc and 275MW-ac PV solar facility, in New South Wales, Australia, equidistant between Sydney and Adelaide, 500km inland, at -35ºS latitude. As a case study for large-scale solar generation, we have evaluated its output, every 5-minutes, over the course of 2023 (105,000 data-points!).
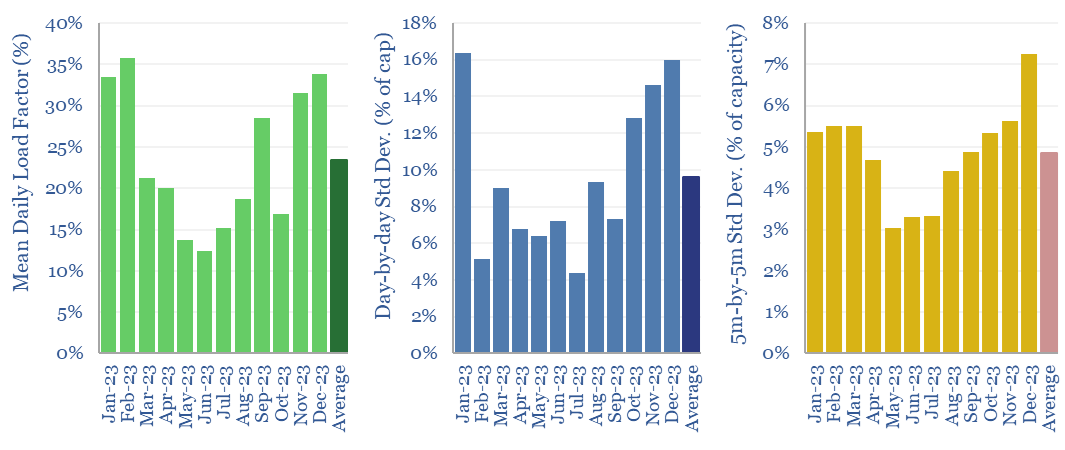
Darlington Point ran at a 23% average load factor in 2023, generating 545 GWH of electricity. However, the data-file illustrates four types of solar volatility.
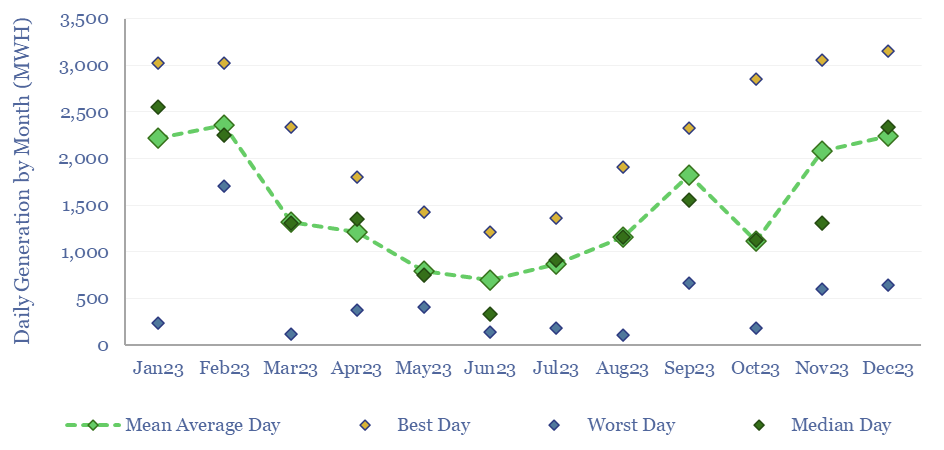
We see the volatility of solar generation most fairly by looking at the load profile in the median day of each month across the year. In other words, output was higher than shown in the median day, across 50% of the days in the month, and lower across another 50% of the days.
Seasonal volatility is extreme. Darlington Point achieved a very high load factor of 35% during the peak of summer, from December to February, but just 12% load factor in June, which means winter output was 65% lower than summer output. Backstopping seasonal volatility is challenging for batteries.
Daily volatility averaged +/- 10%. In other words, output on any typical day of solar generation was likely to be +/- 10% higher or lower than the previous day, due to changes in weather.
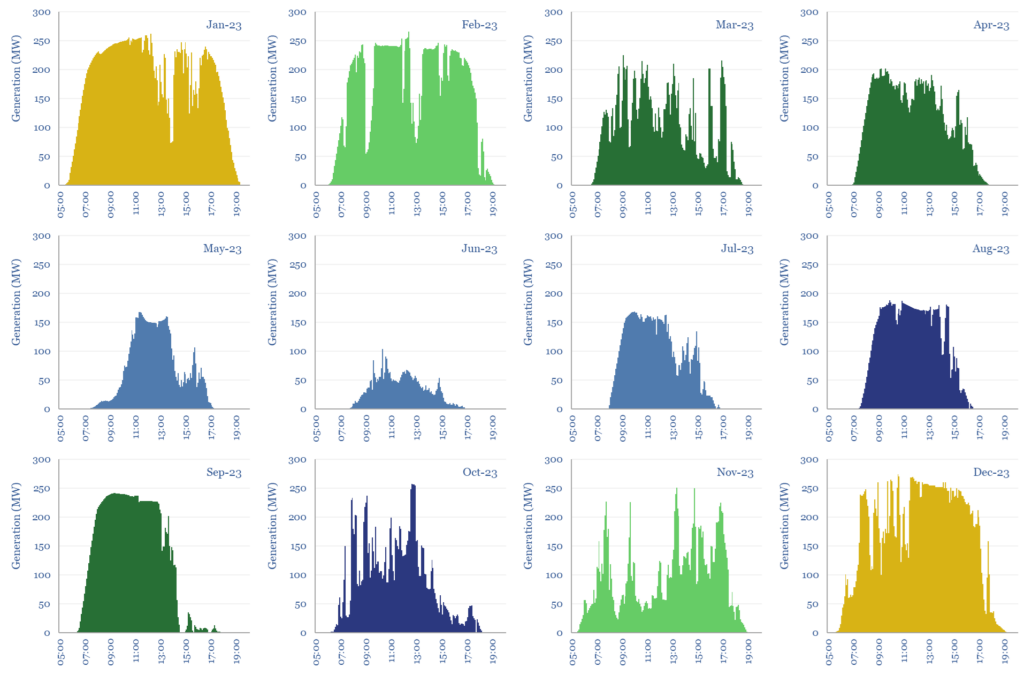
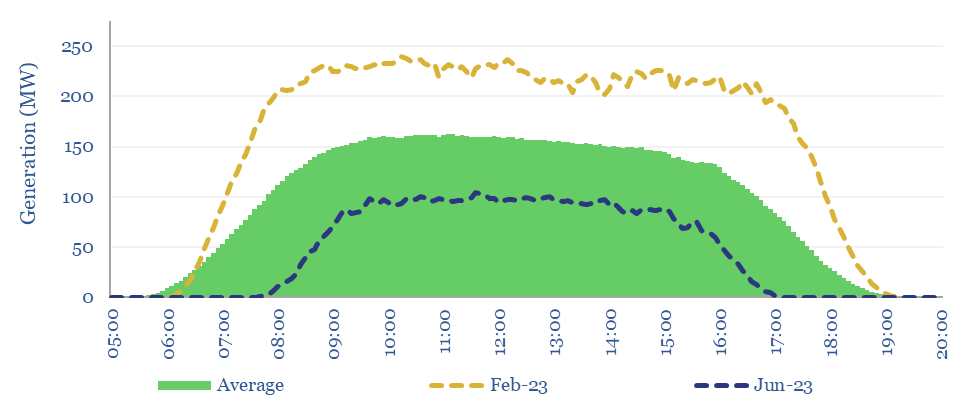
Intra-day volatility sees output ramping in the morning, plateauing in the afternoon, then declining in the evening. The intra-day pattern varies month-by-month. February was the ‘best month’ as most days were sunny. Often generation declined in the afternoon, which we think is due to convective cloud formation.
Minute-by-minute volatility averages +/- 5% every 5-minutes. However, there is a sharp skew in the data, as output is consistently zero at night, many days contained stable generation for long periods, and then have sharp power drops due to cloud cover. On some days, output varies +/- 10% every 5-minutes. This is another reason solar requires back-ups.
Data in the file are from Australia’s Energy Market Operator (AEMO). The statistical analysis and collation into Excel are our own. Flipping through the tabs of the data-file is a nice way to visualize volatility.
Conclusions are similar to other data-files we have compiled into solar volatility. We see increasing value in backstopping volatility across global energy systems.