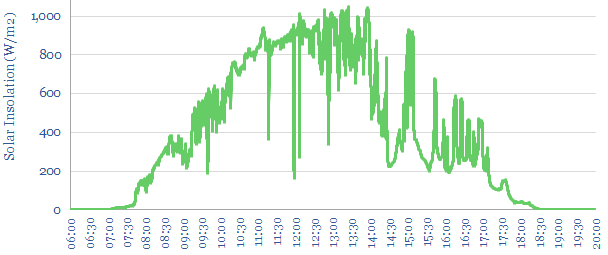
…shows the second-by-second solar output at a typical-good day, with relatively little short-term volatility. The statistical distribution of different days’ solar volatility is plotted in candlestick charts and marimekko charts…
…economically smooth them. Solar heavy grids may thus become prone to unbearable volatility? Our 17-page note outlines this important challenge, and finds that high-voltage interconnectors cure renewables volatility most effectively….
…in a 500m x 1,500m array in Hawaii. We want to use this data-site to understand the typical second-by-second volatility of solar output from a solar plant. $399.00 – Purchase Checkout Added…
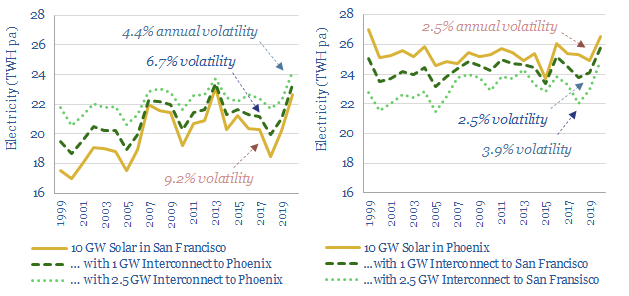
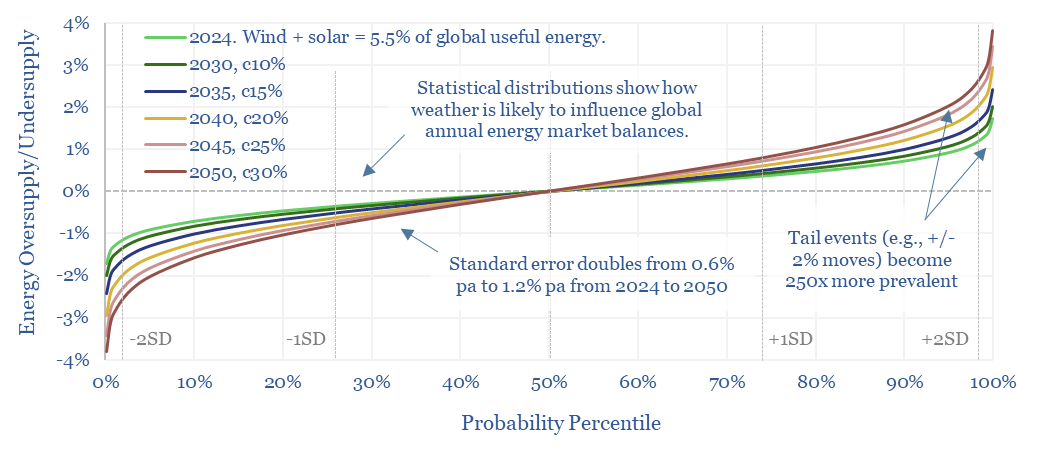
…and year-by-year volatility is 9% of the annual average. Solar insolation is volatile. It would be helpful for a stable grid to smooth each of these different time-periods of volatility….
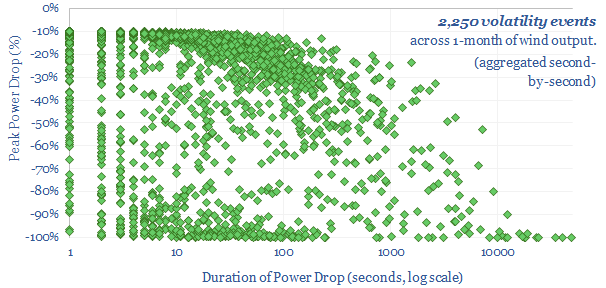
…of solar power. We were hoping that the second-by-second volatility of wind power would be less volatile. However, if anything, wind power is more volatile than solar. Volatility events for…
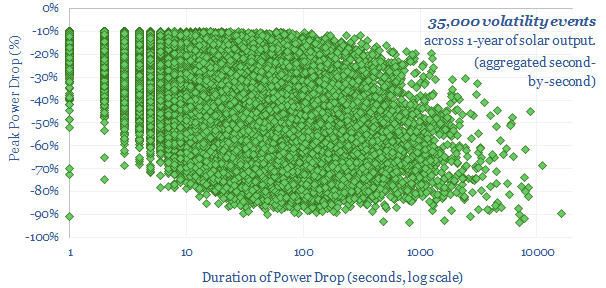
…of electricity. However, the data-file illustrates four types of solar volatility. We see the volatility of solar generation most fairly by looking at the load profile in the median day…
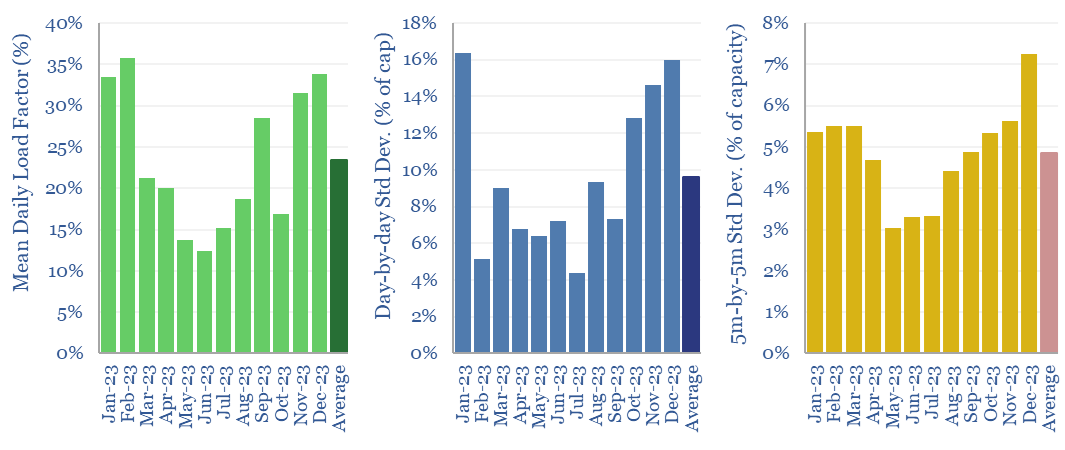
…Detailed numbers are given for the annual volatility of hydro (page 3), volatility of wind (page 4) and volatility of solar (page 5). The volatility of today’s incumbent energy sources…
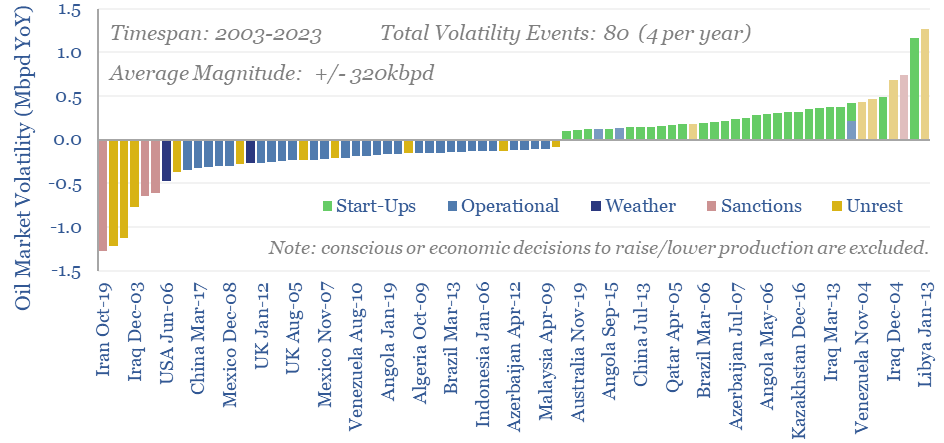
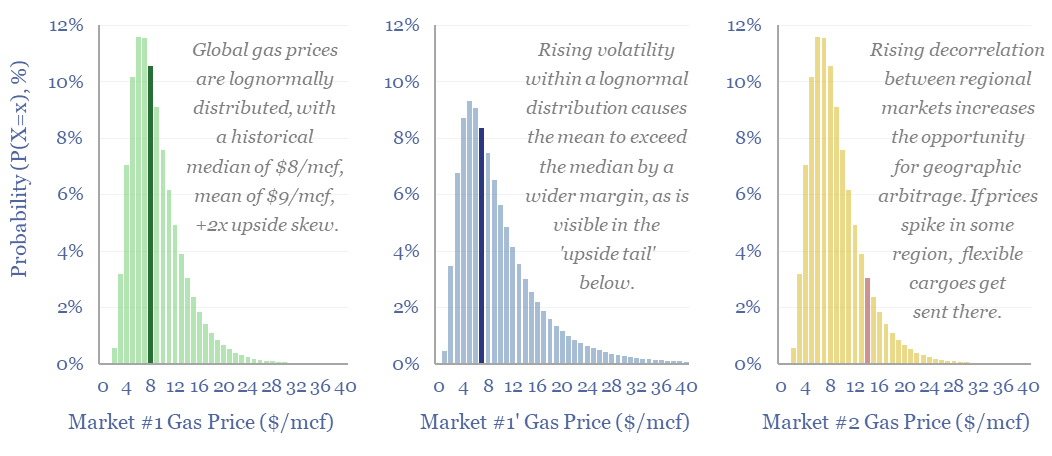
…volatility versus downside volatility? The statistical distribution of oil market volatility is quantified on pages 6-7. Disruptions can occur, but they can also reverse. Oil market volatility versus oil market…
…cart Global energy markets are growing increasingly volatile, as argued in our January-2024 quantification of energy market volatility. Key reasons are the volatility of wind and solar, which are gaining…
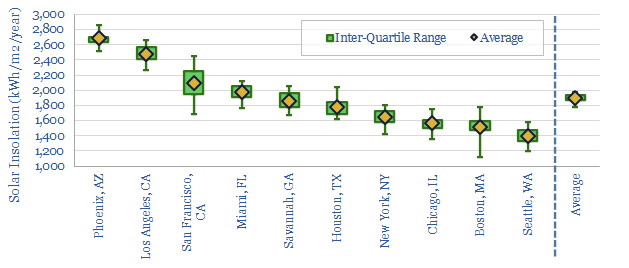
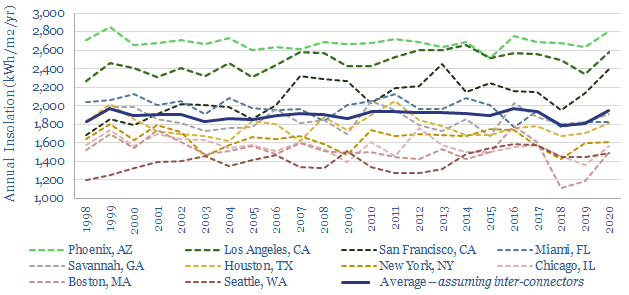
How much does solar energy vary by year in typical locations? To answer this question, this data-file aggregates the average annual volatility of solar (and wind) resources across ten locations,…