Shale growth: what if the Permian went CO2-neutral?
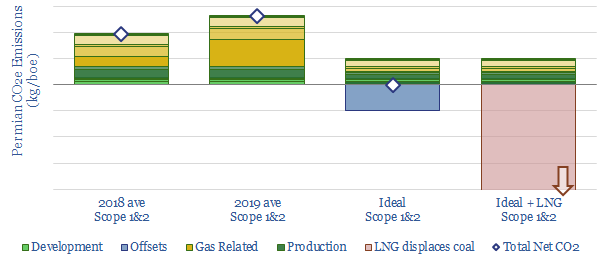
Shale growth has been slowing due to fears over the energy transition, as Permian upstream CO2 emissions reached a new high in 2019. We have disaggregated the CO2 across 14…
the research consultancy for energy technologies
Shale growth has been slowing due to fears over the energy transition, as Permian upstream CO2 emissions reached a new high in 2019. We have disaggregated the CO2 across 14…

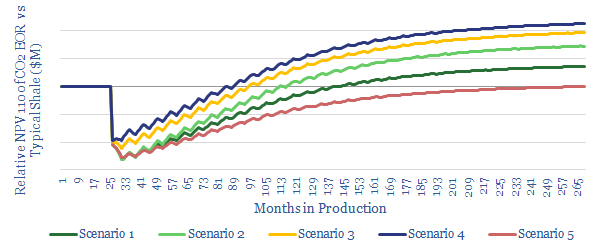
We see enormous opportunity from CO2-EOR in the Permian. It can double well productivity, generate 15-20% IRRs (at $50 oil) and uplift production potential from the basin by 2.5Mbpd. The…
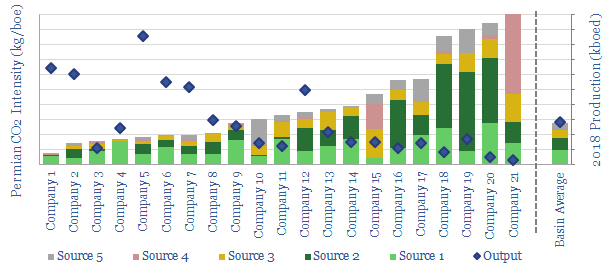
This data-file tabulates Permian CO2 intensity based on regulatory disclosures from 20 of the leading producers to the EPA in 2018. Hence we can calculate the basin’s upstream emissions, in…
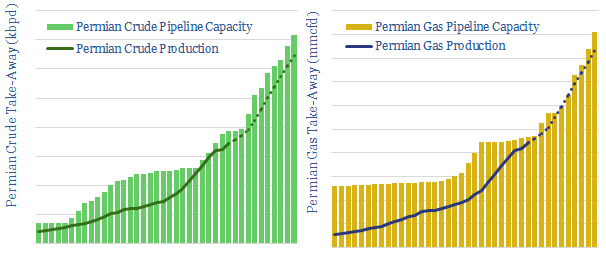
This data-file tracks c50 oil and gas pipelines in the Permian basin — their route, their capacity and their construction progress — in order to assess the severity of pipeline…
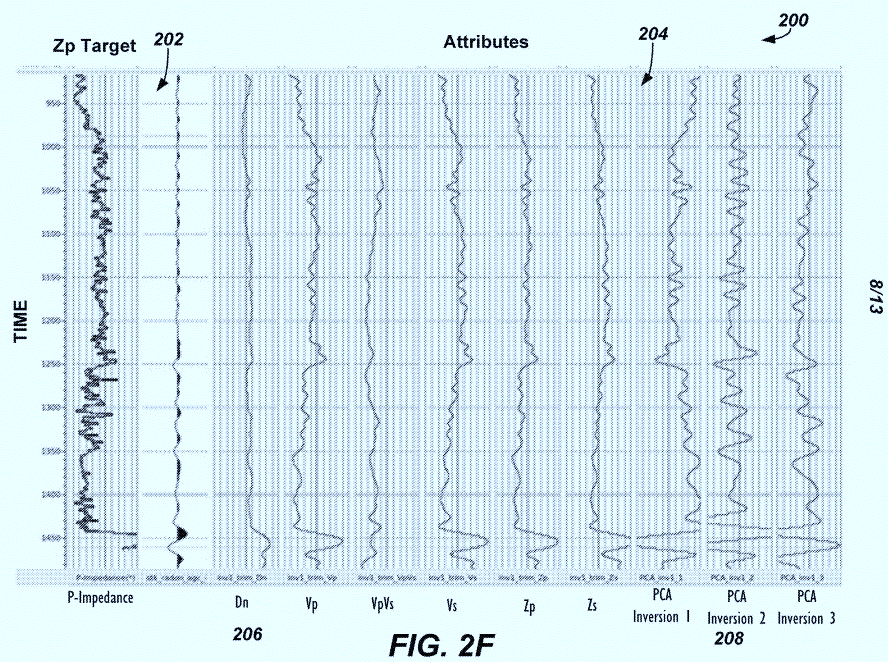
…better production rates should follow. [restrict] Pioneer Natural Resources has patented a new methodology in 2018, to calibrate its seismic images in the Permian, with reference to its well-logs. Ordinarily…
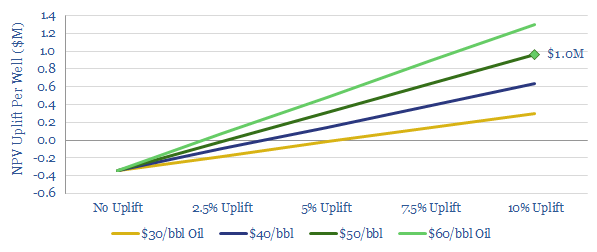
We have modelled the economic uplift of extra digital instrumentation on a typical Permian well. If the data can uplift production by 2.5%, then c$0.4M of instrumentation costs would “pay…
…it for Permian-EOR; with its equity interest in NetPower, 1.6M net Permian acres, and leading CO2-EOR technology. Quotes from the call are below: On CO2-EOR: “We are investing in technologies…
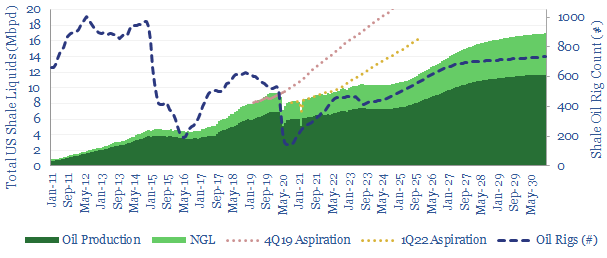
What outlook for US shale in the energy transition? This model sets out our US shale production forecasts by basin. It covers the Permian, Bakken and Eagle Ford, as a…
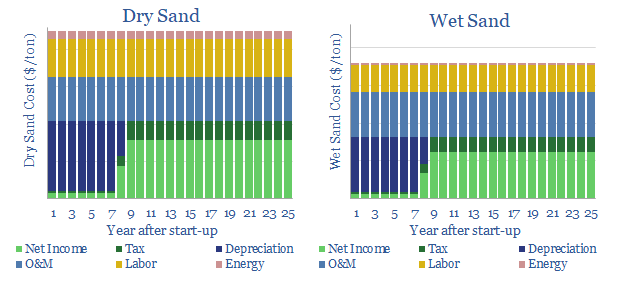
…the 43MTpa of dry sand supplied in the Permian in 2018, where all the moisture has been burned away in a kiln, shortly after the washing process. Wet sand has…
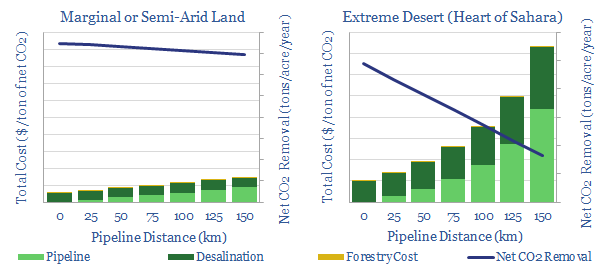
…be sufficient in semi-arid climates, while the best economics of all use waste water from oil and gas, such as in the Permian basin. $339.00 – Purchase Checkout Added to cart The…