Search results for: “smooth operators”
-
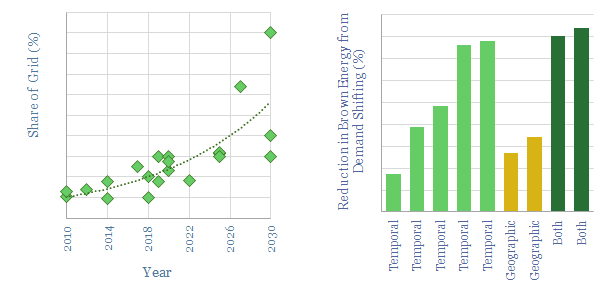
Smooth operators: who benefits from volatile power grids?
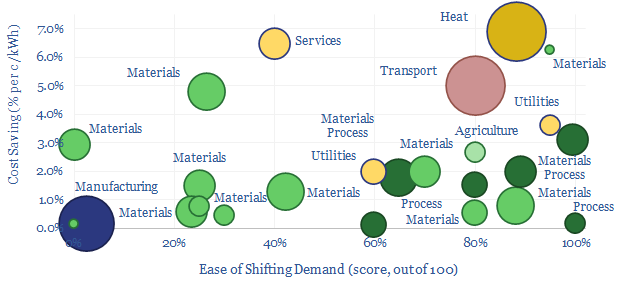
Some industries can absorb low-cost electricity when renewables are over-generating and avoid high-cost electricity when they are under-generating. The net result can lower electricity costs by 2-3c/kWh and uplift ROCEs by 5-15% in increasingly renewables-heavy grids. This 14-page note ranges over 10,000 demand shifting opportunities, to identify who can benefit most.
-
Power transmission: inter-connectors smooth solar volatility?
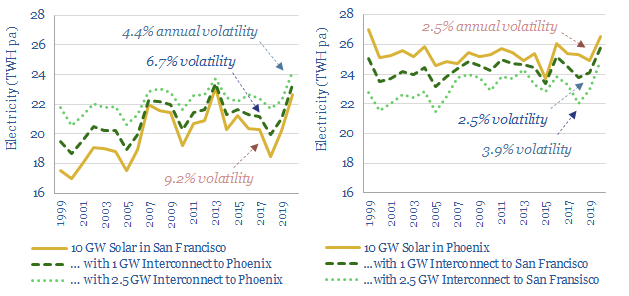
Can large-scale power transmission smooth renewables’ volatility? To answer this question, this horrible 18MB data-file aggregates 20-years of hour-by-hour solar insolation arriving at four cities in the US. The volatility in year-by-year can be halved by a single inter-connector.
-
Methane emissions from pneumatic devices: by operator, by basin?
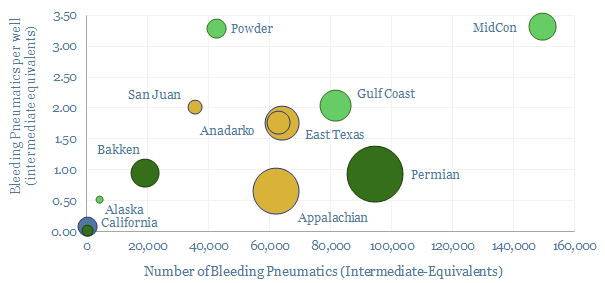
Methane leaks from 1M pneumatic devices across the US onshore oil and gas industry comprise 50% of all US upstream methane leaks and 20% of upstream CO2. This file aggregates the data. Rankings reveal operators with a pressing priority to replace >100,000 medium and high bleed devices, and other best-in-class companies.
-
Renewables: how much time to connect to the grid?
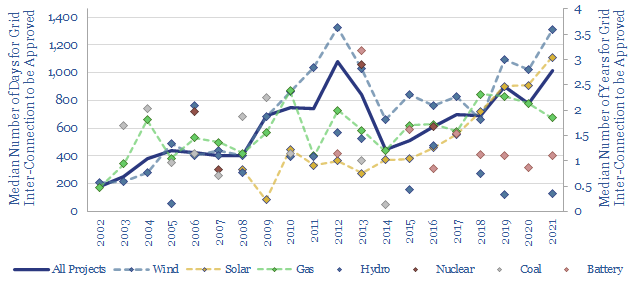
Is the power grid becoming a bottleneck for the continued acceleration of renewables? The median approval time to tie a new US power project into the grid has climbed by 30-days/year since 2001, and doubled since 2015, to over 1,000 days (almost 3-years) in 2021. Wind and solar projects are now taking longest. This data-file…
-
Data-centers: electricity use and demand shifting?
This data-file estimates data-centers’ electricity use and ability to demand shift. Large data centers how power demand in the range of 50-500MW. Around 40% of their electrical loads can demand shift, to help smooth out the volatility of renewables?
-
Solar+battery co-deployments: output profiles?
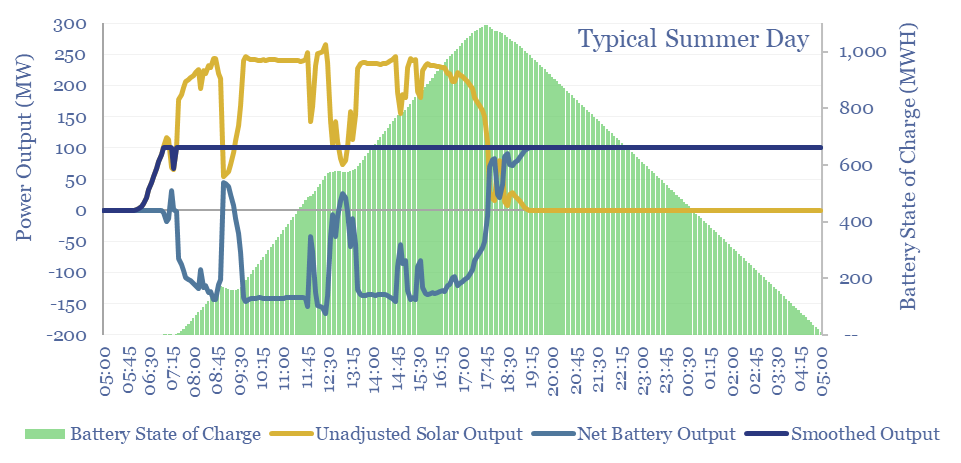
Solar+battery co-deployments allow a large and volatile solar asset to produce a moderate-sized and non-volatile power output, during 40-50% of all the hours throughout a calendar year. The smooth output is easier to integrate with power grids, including with a smaller grid connection. The battery will realistically cycle 100-300 times per year.
-
Capacitor market: leading companies?
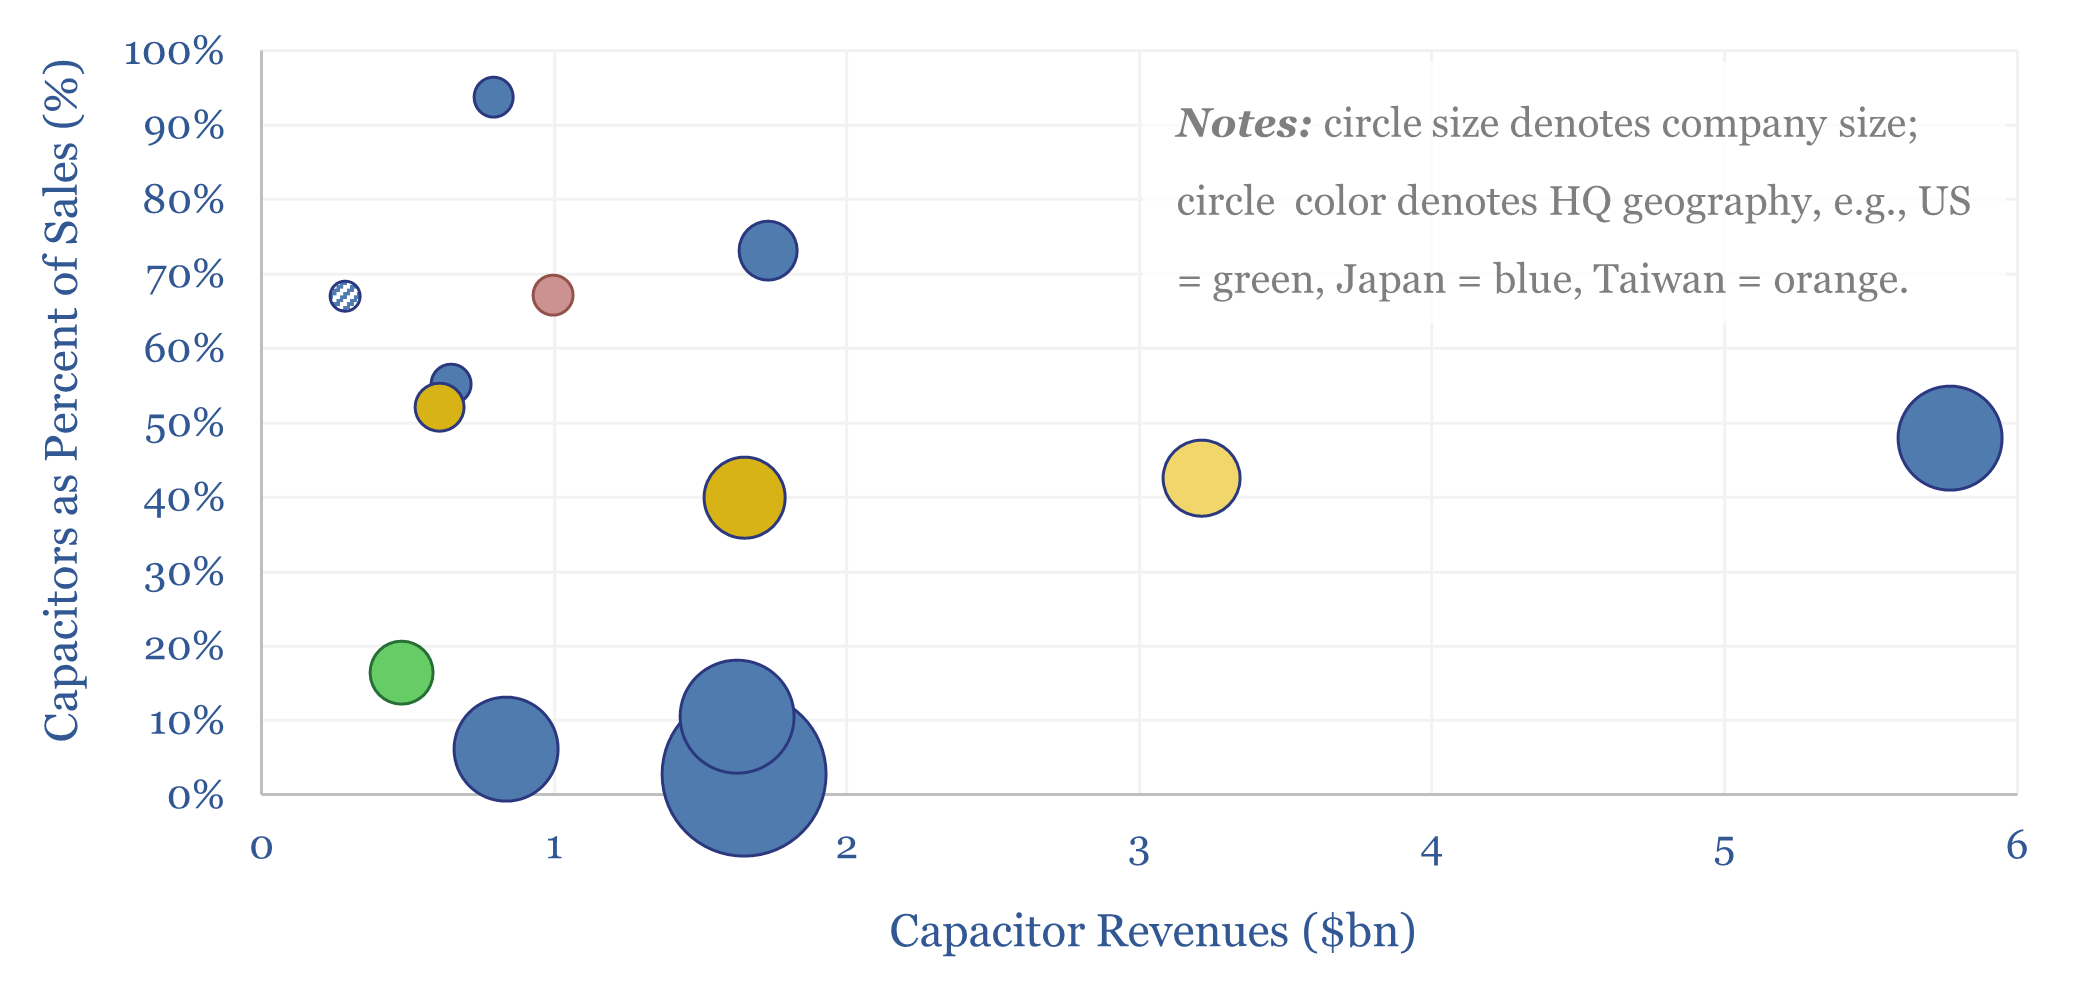
This data-file profiles a dozen leading companies in capacitors, which control two-thirds of the $30bn pa global market. Many companies also produce other passive electronic components, sensors and MOSFETs. Hence will the rise of AI, especially transient-heavy data-centers, pull on demand?
-
At the cutting edge of EOR?
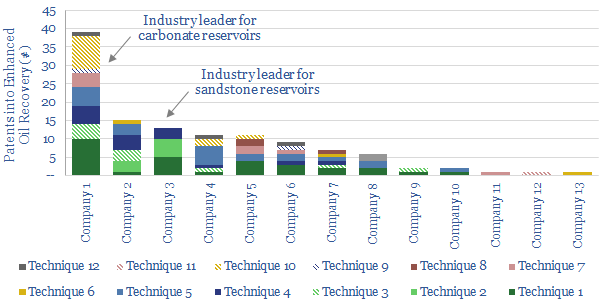
This data-file summarises 120 patents into Enhanced Oil Recovery, filed by the leading Oil Majors in 2018. Hence, we can identify clear leaders in EOR technology, and what they are doing at the cutting edge, to improve recovery and lower decline rates. As the world’s oilfields age, leading EOR technology will help avoid the higher…
-
Screen of companies detecting methane leaks?
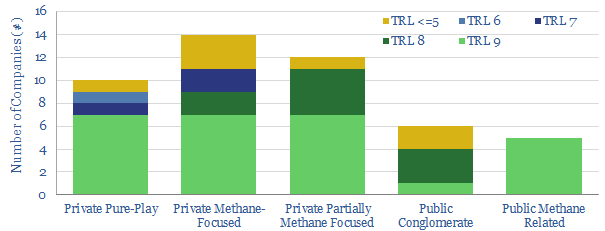
This data-file screens the methods available to monitor for methane emissions. Notes and metrics are tabulated. Emerging methods, such as drones and trucks are also scored, based on technical trials. The best drones can now detect almost all methane leaks >90% faster than traditional methods. c34 companies at the cutting edge are screened.
-
US CO2 and Methane Intensity by Basin
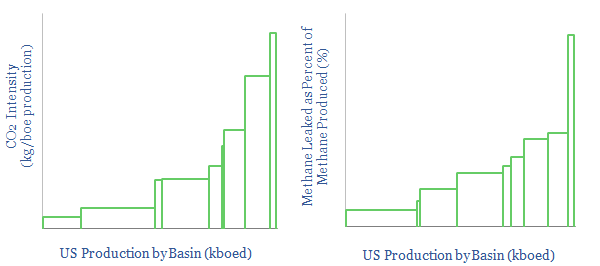
The CO2 intensity of oil and gas production is tabulated for 425 distinct company positions across 12 distinct US onshore basins in this data-file. Using the data, we can aggregate the total upstream CO2 intensity in (kg/boe), methane leakage rates (%) and flaring intensity (in mcf/boe), by company, by basin and across the US Lower 48.
Content by Category
- Batteries (89)
- Biofuels (44)
- Carbon Intensity (49)
- CCS (63)
- CO2 Removals (9)
- Coal (38)
- Company Diligence (95)
- Data Models (840)
- Decarbonization (160)
- Demand (110)
- Digital (60)
- Downstream (44)
- Economic Model (205)
- Energy Efficiency (75)
- Hydrogen (63)
- Industry Data (279)
- LNG (48)
- Materials (82)
- Metals (80)
- Midstream (43)
- Natural Gas (149)
- Nature (76)
- Nuclear (23)
- Oil (164)
- Patents (38)
- Plastics (44)
- Power Grids (130)
- Renewables (149)
- Screen (117)
- Semiconductors (32)
- Shale (51)
- Solar (68)
- Supply-Demand (45)
- Vehicles (90)
- Wind (44)
- Written Research (354)