US natural gas: the stuff of dreams?

US gas demand and supply up to 2035

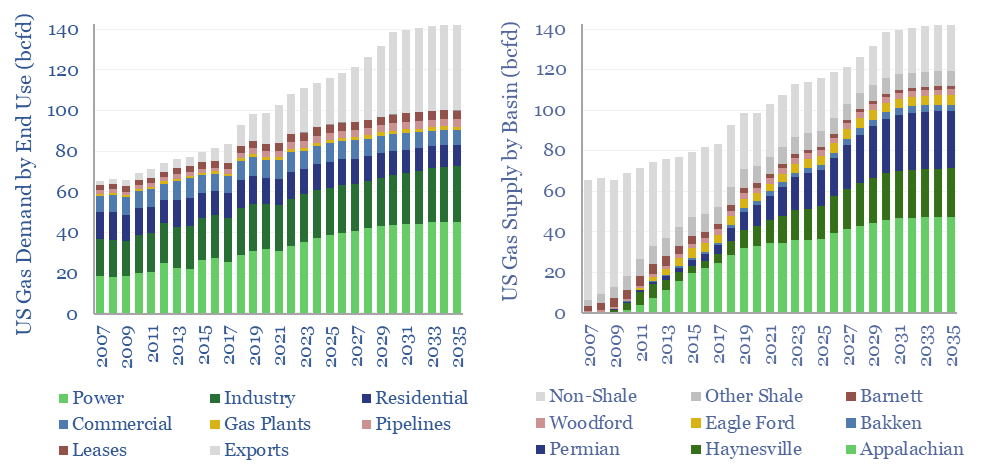
Modeling US gas supply and demand can be nightmarishly complex. Yet we have evaluated both, through 2035. This 13-page report outlines the largest drivers of demand, requires a +3% pa CAGR from the key US shale gas basins, and argues the balance of probabilities lies to the upside.


US gas supply-demand matters in the energy transition, in our US energy models and across the shale industry. But the forecasting can be woefully complex, as gas is the bottom of the US LCOE cost curve, and hence it acts as a balancing line.

Hence to forecast US gas consumption, first you need to forecast total US energy consumption, then you need to deduct all other sources of energy supply. Especially in the power sector. In turn, this makes gas demand for power sensitive to all of these other variables.

After five years of research, we actually have done the necessary work to forecast US gas supply and demand, based on the energy consumption of AI, electric vehicles, wind, solar, nuclear, coal phase-outs, grid bottlenecks, gas peakers, global LNG, key export markets, materials demand, reshoring, blue hydrogen, blue ammonia, blue steel, blue chemicals and CCS. It is all connected.

Our definition of US gas markets – what is included and not included in 2023’s 113bcfd market – is spelled out on page 2.

Our outlook for US gas demand in power is discussed on pages 3-5, including bridges of US electricity demand growth, the share that will come from gas, and possible upside on changes in the efficiency of the gas-fired fleet, as baseload plants run more like peakers.

Our outlook for US LNG exports is discussed on pages 6-7. Recent data show countries such as China switching diesel trucks to LNG, and there is upside to our numbers.

Our outlook for gas heating is discussed on pages 8-11. Growth in industrial gas is well underpinned. But after excluding the impacts of weather, recent data suggest a slower phase-back of residential gas heating.

Our outlook for US gas supply, to meet rising demand, is discussed on pages 12-13. It hinges on our US shale forecasts, Marcellus productivity, shale gas economic models, and most interestingly, whether an oil price pullback could pull harder on shale gas basins.

Hence the note concludes by discussing what gas prices might be needed to unlock these requisite volumes. We look forward to discussing our US gas supply-demand outlook with TSE subscription clients.

Seeing sense: digitize the downstream gas network?

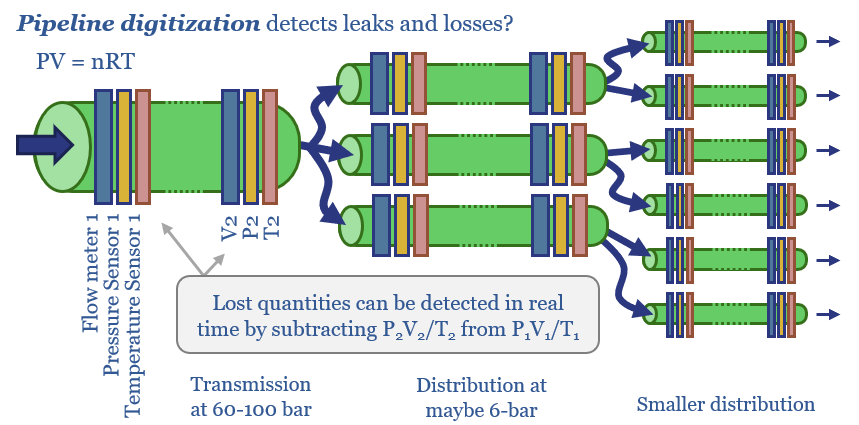
Pipeline sensing to detect flows and leaks

Greater digitization of gas networks looks increasingly important, as gas, biogas, hydrogen and CCS all aim to shore up their futures. This 15-page note started as a deep-dive into the true leakage rates in downstream gas; and ended up finding opportunities in sensors and pipeline monitoring.


Gas sensing is going to be increasingly important, to detect and remediate leaks in the gas network. And all the more so, as gas networks aim to earn their keep in the evolving energy system, while perhaps expanding to include more biogas, hydrogen and/or CCS.

But debatably, there is little point to other clean initiatives if the industry cannot improve monitoring and leakage within its gas networks, and especially gas distribution networks. Our outlooks for biogas, hydrogen, CCS and US gas volumes are on pages 2-3.

Methane leaks matter for the future of gas value chains and require digitization of gas networks. Climate goals have now spawned a large drive to mitigate methane. The key numbers and breakdowns of methane leaks, by industry and sub-industry are re-capped on pages 4-5.

1-5% less gas is metered flowing out of a typical downstream gas network than flows in. This is known as Unidentified Gas (UIG) in the UK or Lost and Unaccounted For Gas (LAUF) in the US. These numbers are increasingly controversial and open the door to gas critics. Our review of the numbers and controversies is on pages 7-10.

Digitizing the downstream gas network is the most widely discussed solution, to detect and remediate leaks in real time, while also potentially lowering the operating and maintenance costs across the network. Costs of methane mitigation are stress-tested on page 11.

We have screened a dozen companies that are specialized in gas pressure sensing and monitoring, and added them to our screen of technologies for mitigating methane leaks. Sensing is a fascinating industry worth $200bn pa across all sectors. Our highlights and observations about these dozen companies are on pages 12-15.

Global energy demand: false ceiling?

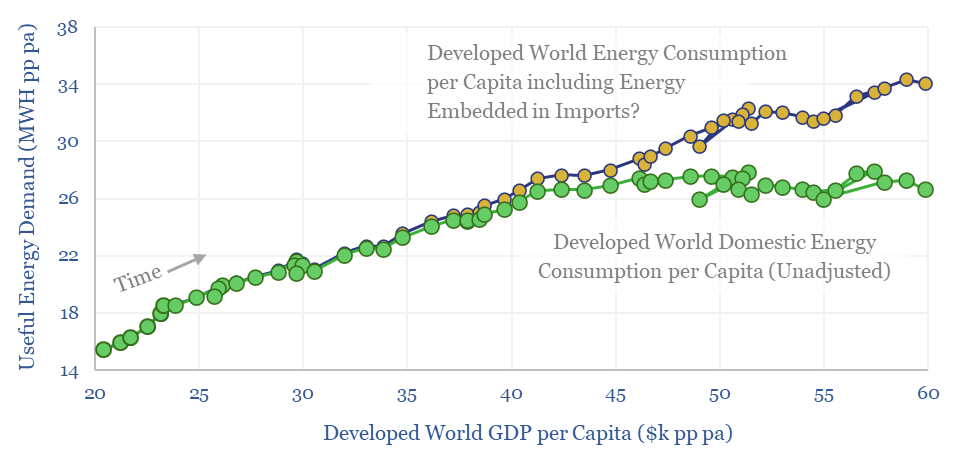
Useful energy demand in the developed world still increases steadily with GDP if you account for energy embedded in imports.

Can GDP decouple from energy demand? Wealthier countriesโ€™ energy use has historically plateaued after reaching $40k of GDP per capita. Hence could future global energy demand disappoint? This 15-page report argues it is unlikely. Adjust for the energy intensity of manufacturing and imports, and energy use continues rising with incomes.


Some commentators argue that energy demand will naturally plateau as GDP rises in the future โ€“ or at least the beta between energy use and GDP will fall dramatically. As evidence, the energy consumption within developed world countries has hardly increased over the past 20-years, even as GDP per capita rose by 25%. But can this really be right?

Our outlook for global energy demand is re-capped, with charts illustrating different nations’ energy demand versus incomes, on pages 2-3.

The debate about whether energy demand plateaus with income also matters as markets are starting to price in a re-acceleration of energy, and especially electricity, in many regions, linked to the rise of AI.

At the micro level, there is a strong correlation between income levels and different underlying forms of energy consumption, within wealthy nations, as shown on pages 5-6.

At the macro level, there is also a strong correlation between income levels and underlying forms of energy consumption between nations, where demand markers are still rising steadily, as shown on pages 7-8.

We argue that a shift in global Manufacturing almost fully explains the apparent slowdown in energy demand in wealthier countries. This argument is illustrated in six different ways on pages 9-14.

Manufacturing GDP is 8x more energy intensive than Services GDP. Underlying energy demand is still rising steadily with incomes in the developed world, once we factor in the energy that is embedded in an ever-increasing share of imported products, whose manufacturing we have found convenient to outsource to the emerging world, especially China.

Can GDP decouple from energy demand? Only if you are comparing apples and oranges. Underlying energy demand clearly rises with incomes. Global energy demand will continue rising with global GDP. But where the energy is used depends on which countries do the manufacturing.

Manufacturing activity is thus the crucial variable for the future of energy demand. We see this in our breakdown of global energy demand. And we do see more global manufacturing ahead amidst the largest manufacturing project in human history, aka energy transition.

Many factors drive global energy demand from one year to the next: macro conditions, weather, prices and policies. We still think that efficiency gains (for converting primary energy into useful energy) will step up from 0.8% pa historically to 1.2% pa globally as part of the energy transition. But we do not find much evidence that energy use flatlines beyond some magic income threshold.

Mapping vehicle value chains?

Markets exposed to EV and ICE production

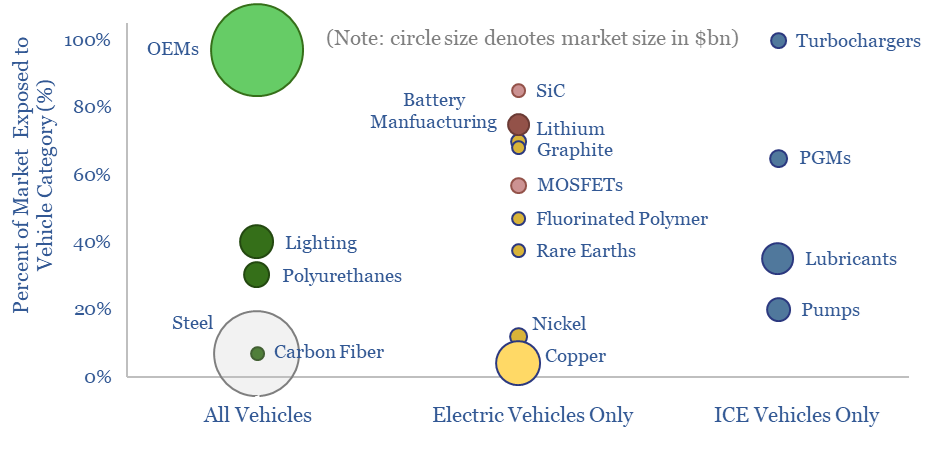
Who is impacted if vehicle sales, EVs or ICE volumes surprise? Autos are a $2.7 trn pa global market, a vast 2.5% of global GDP. 15% is gross margin for OEMs. The other 85% is spread across vehicle value chains, encompassing metals, materials and capital goods. Hence this 14-page note highlights 200 companies from our database of 1,500 companies. Some are geared to ICEs. Some to EVs. And some to both.


Our research in 3Q24 has wondered whether EV sales might saturate at 15-30% of developed world vehicle sales through 2030, due to total costs of ownership and challenges reaching cost-competitiveness. This means our latest vehicle forecasts only see 40M EV sales in 2030, down from 65M envisaged a year ago.

The aim of this 14-page report is to look through our companies database, which covers 2,500 mentions of 1,500 companies in value chains that matter for energy transition. Specifically for vehicle value chains, which companies are geared to ICEs, geared to EVs, or to both?

Automotive OEMs are most directly geared to vehicle purchasing decisions, as our screen of global OEMs finds that the top twenty largest auto producers have adopted very different strategies towards electrification, as discussed on pages 4-5.

Our best ideas into the themes and companies that are geared to ICEs are outlined on pages 7-9. We highlight three companies in detail, amidst a broader discussion of c25 companies.

Our best ideas into the themes and companies that are geared to EVs are outlined on pages 10-12. It is astounding how many industriesโ€™ story is now tied to the long-run ascent of EVs.

Another idea that we discuss is the possibility of consumers simply owning more vehicles overall: EVs for clean urban mobility AND ICEs for longer distance travel with larger payloads. (It is interesting how many clients have written in, off the back of our broader EV research in 3Q24, to highlight how they have purchased EVs as the second, third… or in one case, sixth (!) vehicle within their households).

Our best ideas into the themes and companies that are geared to greater vehicle ownership are on pages 12-13. It is fascinating that one of these themes in vehicle value chains overlaps with our thesis into power grid bottlenecks and advanced conductors.

If one thing stands out to us from reviewing the companies in these various value chains, it is the danger of distraction. How many companies have diverted resources away from improving their core products, in order to enter new markets, with uncertain strategies, uncertain costs, uncertain demand, uncertain competition? This concern is not just for vehicle value chains, but across the energy transition. This highlights the importance of energy transition research, data and analysis in corporate decision-making.

LFP batteries: cathode glow?

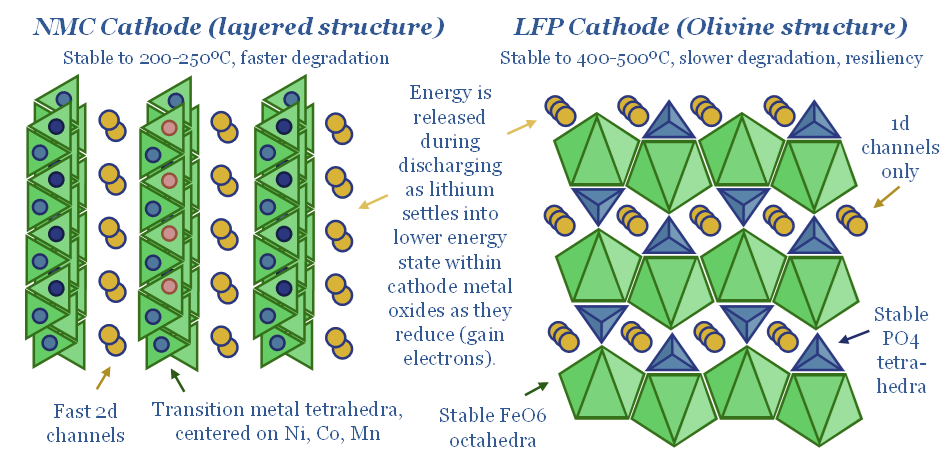
Structural comparison of NMC and LFP cathodes.

LFP batteries are fundamentally different from incumbent NMC cells: 2x more stable, 2x longer-lasting, $15/kWh cheaper reagents, $5/kWh cheaper manufacturing, and $25/kWh cheaper again when made in China. This 15-page report argues LFP will dominate future batteries, explores LFP battery costs, and draws implications for EVs and renewables.


2024 has offered up some exceptionally low battery prices. Most build-ups suggest lithium ion batteries should cost $110-130/kWh. Yet the pricing on Chinese LFP batteries has been reported at $50-80/kWh.

This has become a huge controversy that matters for the electric vehicle outlook, the costs of electric vehicles, the renewables+batteries outlook, and by extension the demand for other energy sources, such as gas peaker plants or long-term oil demand, and the equipment and materials suppliers in all of these value chains.

LFP cathode chemistry is fundamentally different from NMC, and can genuinely drive $20/kWh deflation across battery supply chains. This is a crucial point. Hence the chemical and performance differences of NMC vs LFP are outlined on pages 2-4.

LFP battery costs are lower, specifically because of these chemical and performance differences. Cost savings on the materials side are quantified on page 5, while cost savings on the cathode manufacturing side are quantified on page 6.

Chinese manufacturing of LFP batteries is the biggest reason for the downwards shift in the battery cost curve. Some of this simply reflects lower costs for heavy industrial activity in China and is structural. But we also show how the exceptionally low pricing of 2024 is likely to reflect temporary dislocations, on pages 7-11.

Our forward-looking cost estimates are informed by this analysis, covering global NMC cells, global LFP cells, Chinese LFP cells in 2024, and Chinese LFP cells in 2025+, all in $/kWh terms. These numbers are outlined and discussed on page 12.

How will cheap Chinese LFP impact the EV outlook? We re-evaluate the cost premium of EVs versus ICEs, on page 13.

How will cheap Chinese LFP impact the outlook for renewables and grid-scale batteries? We re-evaluate storage spreads on pages 14-15.

Going platinum: PGMs in energy transition?

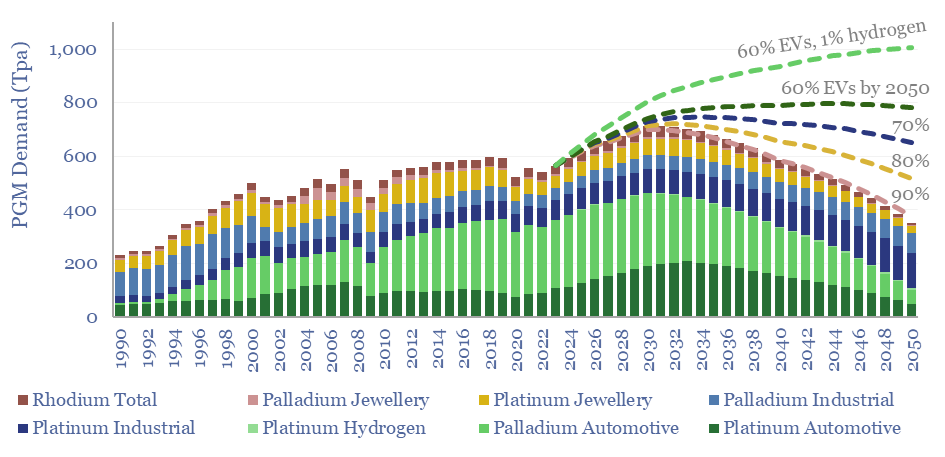
Demand for PGMs in the energy transition from 1990 to 2050. Demand will depend on EV adoption rates.

Could PGMs experience another up-cycle through 2030, on more muted EV sales growth in 2025-30, and rising catalyst loadings per ICE vehicle? This 16-page note explores global supply chains for platinum and palladium, the long-term demand drivers for PGMs in energy transition, and profiles leading PGM producers.


Our electric vehicle outlook has been revised down twice in 2024, due to market saturation, and our updated outlook for EV costs. A year ago, we hoped that EV sales would quadruple, from 14M BEV and PHEV sales in 2023, to 65M units in 2030. We now expect closer to 40M EV sales in 2030. Key observations are re-capped on pages 2-3.

65% of global PGMs are used in the catalytic converters that give today’s ICE vehicles 20-100x lower emissions of CO, NOx, unburned hydrocarbons and particulates compared with 50-years ago. Hence could fewer EVs and more ICEs change the outlook for PGMs in energy transition?

PGMs comprise six silver-white metals, which co-occur in nature and have remarkable catalytic properties: platinum, palladium, rhodium, ruthenium, iridium and osmium. To help understand the industry, this report outlines PGM supply-demand (page 4), pricing (page 5) and use in vehicle catalysts (pages 6-7).

PGM use per ICE vehicle is expected to rise, for three key reasons, which are outlined on pages 8-9. They are linked to the changing vehicle mix, emerging world air standards and increasing deployment of hybrids and turbocharged engines within ICE passenger vehicles.

Hydrogen vehicles do not play a large role in our roadmap to net zero, but present an interesting ‘what if’. Each hydrogen truck contains 4x more PGMs than a typical diesel truck (pages 10-11).

Forecasts and sensitivities for global PGMs in energy transition could see another upcycle through 2030, while the long-term outlook depends upon the ultimate share of EVs and hydrogen vehicles in the 2030-50 fuel mix, as quantified on pages 12-13.

Leading producers of PGMs are profiled on pages 14-16. Eight companies control 90% of global mining, refining and recycling. Mostly mid-caps. Many are trading at 2-15-year lows, due to weak market expectations for PGMs and weak recent PGM pricing, while those that have pivoted towards battery metals have recently profit-warned.


Conclusions in the report are strongly linked to our recent outlook for EV adoption in 2025-30, which is also shown below.

Electric vehicles: the road to cost parity?

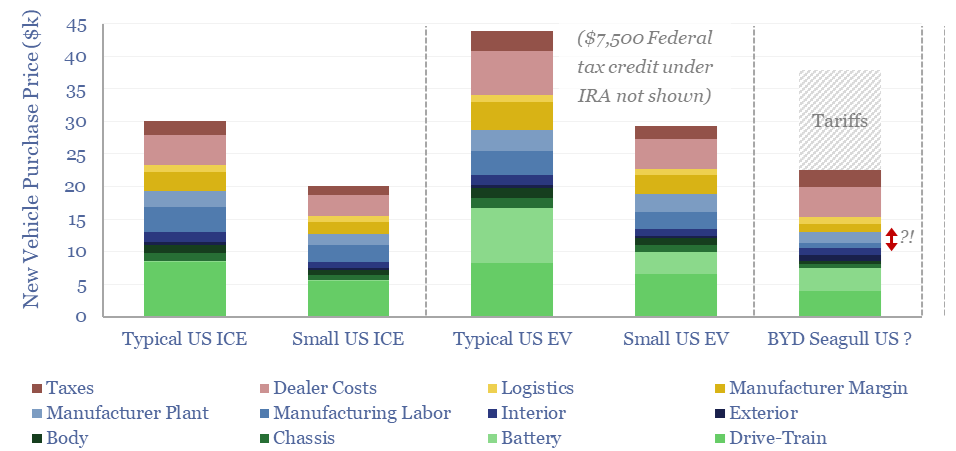
Price breakdown of different types of new vehicles in the US in 2024.

Could electric vehicles deflate towards cost parity with ICEs in 2025-30, helping to re-accelerate EV adoption? This 12-page report into electric vehicle cost parity contains a granular sum-of-the-parts cost breakdown. Then we consider battery deflation, power train deflation, small urban EVs, tax incentives, and the representativeness of low-cost Chinese EVs.


Electric vehicles may saturate at 15-30% of global vehicle sales in 2025-30, well below consensus forecasts, and even our own forecasts from a year ago which saw EVs reaching 50% of global vehicle sales by 2030. This would strongly impact energy, materials and capital goods.

Sometimes a thesis is so important that it needs to be stress-tested from multiple different angles. Hence the purpose of this 12-page report is to assess whether electric vehicle cost parity could be achievable in 2025-30.

We started by breaking down the costs of EVs and ICEs, across 25 cost lines, via two granular sum-of-the-parts models of vehicle costs.

What is driving the costs of electric vehicles today? How much more expensive are they on an apples-to-apples basis? And is it really fair to call an EV simply an ‘iPad on wheels’? Answers to these questions are discussed in the first half of the report.

Electric vehicle cost parity could be achieved by deflating the different cost lines. But how much running-room is left for battery cost deflation? And if we delve into the supply chain, are Tier 1 and Tier 2 suppliers guiding towards any pricing reductions? Answers are on pages 6-8.

Could smaller electric vehicles emerge, drive down costs, and boost adoption? Or can we draw any deflationary conclusions from BYD‘s famous Seagull EV, on sale in China for the equivalent of $10-14k? We have attempted to answer these questions on pages 9-10.

How do subsidies, incentives and tariffs change the costs of electric vehicles in the developed world? And will this boost adoption from here? This topic is discussed on pages 10-11.

Our outlooks for regional EV adoption and regional oil market evolution are re-visited in light of the new analysis on page 12.


Electric vehicles: saturation point?

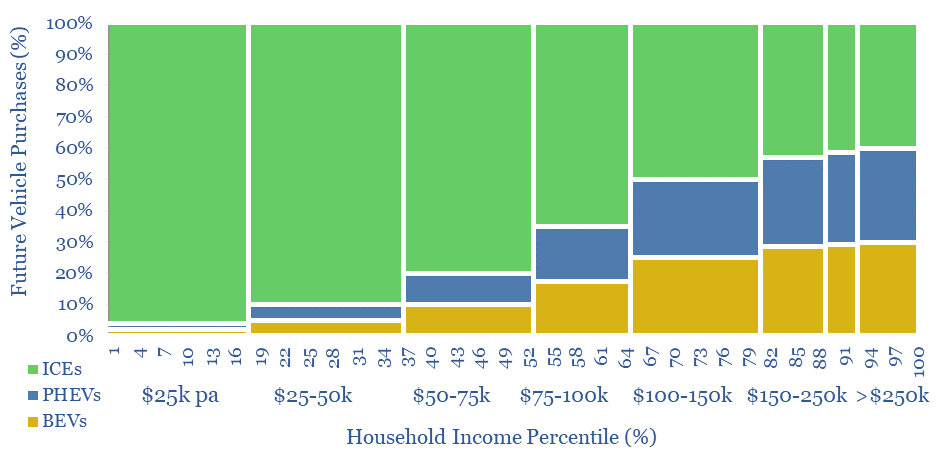
Future vehicle purchases by type and by income level. Most EV and hybrid purchases will be by people with incomes over $100k per year.

Energy transition technologies are often envisaged to follow S-curves: rapidly inflecting, then reaching 100% market adoption. However, this 17-page report argues electric vehicles will more likely saturate at 15-30% of sales in 2025-30. Electric vehicle sales were already at 15% of global vehicle sales in 2023. So what would the more limited EV upside mean for energy and materials?


Electric vehicle sales have recently endured negative news flow. Hence, we have already been forced to revise down our global EV sales forecasts, in June, by 20-25% for 2025-30. The weakness has impacted auto-makers, lithium markets and other materials, as shown on pages 2-3.

So, will EV sales start reaccelerating, or conversely, could they even flatline? The bulls in this debate will point to S-curves, arguing that EV sales are inflecting upwards. But is this really the right conceptual model for EV adoption, for the reasons explored on pages 4-5?

Affordability remains the major barrier for EV adoption in our view. Hence we have gathered data into the distributions of incomes across the developed world, and the distributions of EV costs, on pages 7-8.

Climate attitudes are another barrier for EV adoption. Last year, it was reported that 40% of Americans would not give $2 per month to avoid the worst impacts of climate change. The most relevant survey data into climate attitudes are compiled on pages 9-10.

Hence, we have attempted to model the saturation point for electric vehicles among developed world vehicle purchasers, on pages 11-13.

Market saturation for electric vehicles would have extreme implications across energy and materials markets. Some examples are given on pages 14-15.

Revisions to our numbers are finalized on pages 16-17, across electric vehicles, ICE vehicles, oil demand, the electricity demand of EVs, lithium demand, and with implications across new energies.

Purchasing power: what are generation assets worth?

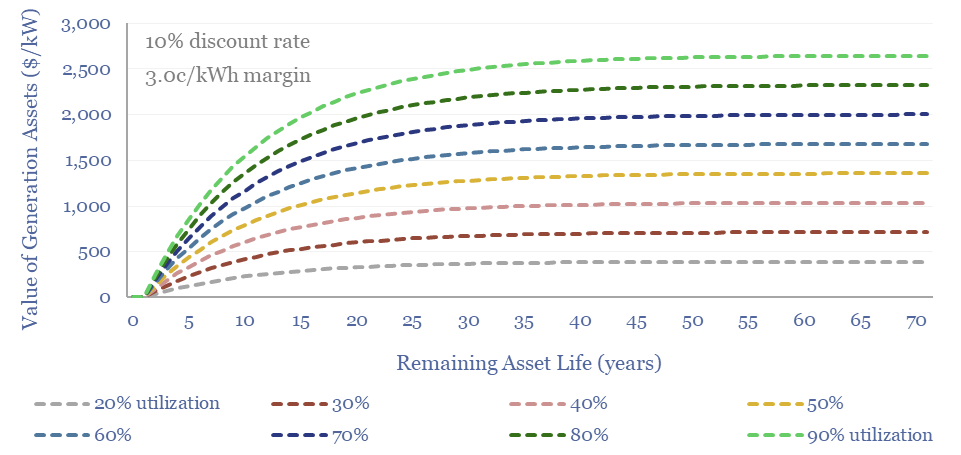
Fair value of generation assets which hinge on their remaining life, utilization, flexibility, power prices, rising grid volatility and CO2 credentials.

There has never been more controversy over the fair values of power generation assets, which hinge on their remaining life, utilization, flexibility, power prices, rising grid volatility and CO2 credentials. This 16-page guide covers the fair value of generation assets, hidden opportunities and potential pitfalls.


What is the fair value of a portfolio of power generation assets? This question increasingly matters, for the valuations of independent power producers, for assessing deal flow in the utility sector, for renewable energy developers, and for those looking to secure reliable power for new loads amidst grid bottlenecks.  

Hence this 16-page report is a guide to the fair value of generation assets, drawing on over 100 notes, models and data-files, published over the past five-years, and available to TSE subscription clients.

The work is informed by transaction prices for generation assets and replacement costs, but most of all by NPV calculations for onshore wind, offshore wind, solar, hydro, nuclear, gas CCGTs, gas peakers, coal, biomass and diesel gensets.

A good general ballpark for the fair value of any generation asset, in $/kW terms, is spelled out as a function of three variables on pages 4-5.

A crucial consideration is that power grid volatility is rising, which in turn affects the pricing and margins that can be achieved by different generation assets, as shown on pages 6-7.

As a result, we see rising fair values for gas peaker plants and grid-scale batteries, as quantified on pages 8-9, but looming PPA cliffs for maturing solar and wind assets, considered on pages 10-12.

Carbon credentials are another dimension which can sway the value of generation assets, especially amidst rising RECs prices, and changing regulations. Our valuation framework is on pages 13-14.

Immediacy is yet another variable that can sway the perceived value of generation assets, and could lead to unprecedently high future deal prices for low-carbon baseload assets, such as nuclear and hydro generation facilities, per pages 15-16.

The next few years will yield some fascinating deal prices for generation assets, amidst rising grid volatility and CO2 considerations. 

Oil demand: making millions?

What are the best pathways for decarbonization and reducing global oil demand?

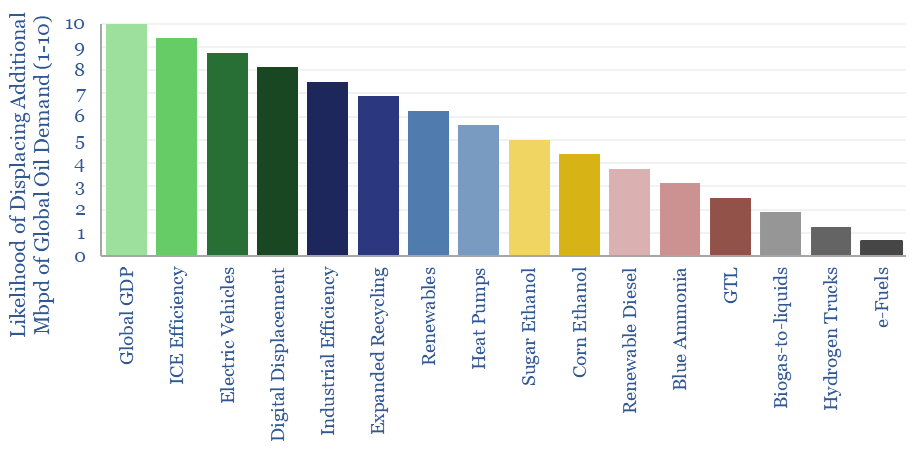
What does it take to move global oil demand by 1Mbpd? This 22-page note ranks fifteen themes, based on their costs and possible impacts, to show what drives global oil demand, where risks lie for oil markets, and where opportunities are greatest to drive decarbonization. We still think global oil demand plateaus around 105Mbpd mid-late in the 2020s, before declining to 85Mbpd by 2050. But the risks now lie to the upside?


Global oil demand will run at 103Mbpd in 2024, growing another 1Mbpd from 2023. Yet the lowest-cost and most practical roadmap to net zero would see oil use plateau around 105Mbpd in the mid-2020s, then decline to 85Mbpd by 2050.

There is huge hubris in these forecasts. We are assuming that after a century of growth, averaging +1Mbpd/year since 1990, oil demand will suddenly start stagnating, then declining. Are we as forecasters really able to outsmart historical precedents, especially given forecasters’ poor track records in predicting the future? (pages 2-3).

Our methodology in this report is to take fifteen of the most important themes that could sway global oil markets, then to evaluate what it would take for each theme to move global oil markets by 1Mbpd, in terms of capex, ongoing costs, oil price breakevens, resource requirements and land intensities. Thus we have written a 1-2 page snapshot for each theme, covering our favorite facts and figures (pages 4-21).

Covered themes are GDP growth, fuel economy, electric vehicles, going online, industrial efficiency, expanded recycling, wind and solar, heat pumps, corn ethanol and sugar ethanol, renewable diesel, ammonia shipping fuels, biogas to liquids, hydrogen trucks and e-fuels.

What drives global oil demand? Of the fifteen themes, we reach the conclusion that only three themes can really move oil markets by +/- 5Mbpd over the next decade. Another seven themes may have -1Mbpd impacts over the next decade. Some themes stand out as golden opportunities. Realism is needed when assessing other higher-cost options.

Subtle changes in forecasts, such as 0.5% pa faster GDP growth and a slower deployment curve for electric vehicles could see global oil demand continuing to rise, and ramping up to 110Mbpd by 2050 (page 22).


Copyright: Thunder Said Energy, 2019-2025.