Biofuels: better to bury than burn?

Burying biomass

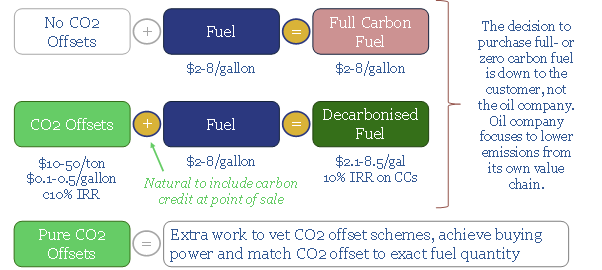
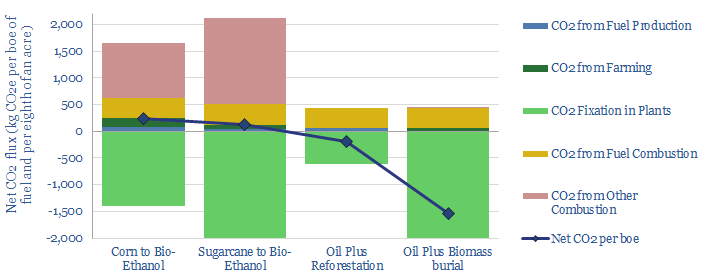
Burying biomass to sequester CO2 could be more economical than biofuel production with a $15-50/ton carbon price. Thus the global bioethanol industry could be disrupted. Burying biomass would also remove 8x more CO2 per acre, at a lower total cost. More conventional oil could be decarbonized with offsets. Ethanol mills and blenders would be displaced. The numbers and implications are outlined in this 12-page report.


Nature-based solutions to climate change need to double annual CO2 uptake from plants in our models of decarbonization, using forests and fast-growing grasses (pages 2-3).

We profile the bioethanol industry, which is already using fast-growing grasses to offset 2Mbpd of liquid fuels. But our models suggest the economics, efficiency and CO2 intensities are weak (pages 4-6).

A first alternative is to reforest the land used to grow biofuels, which would carbon-offset 1.5x more oil-equivalents than producing biofuels (pages 7-8).

A more novel alternative is to bury the biomass, such as sugarcane or other fast-growing grasses, which could sequester 8x more CO2, with superior economics at $15-50/ton CO2 prices (pages 9-11). Another concept is to bury wood for carbon sequestration.

Company implications are summarized, suggesting how the ethanol industry might be displaced, and quantifying the CO2 intensity of incumbents (page 12).

This report was originally published in 2020. We have also deepened our analysis of the corn ethanol industry, CO2 of corn production, alternative uses for bio-ethanol and an outlook for biofuels in the 2020s. We have not seen much progress or momentum behind the idea of burying biomass crops for carbon storage.

Conservation agriculture: farming carbon into soils

Conservation agriculture

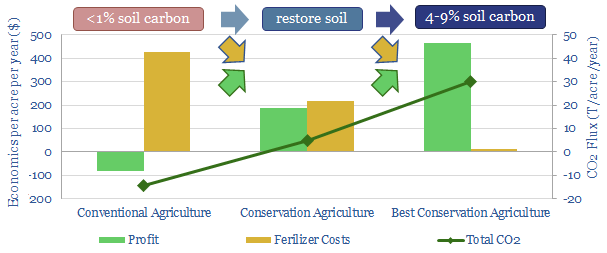
One-third of the atmosphereโ€™s post-industrial CO2 does not derive from fossil fuel combustion but from the degradation of soils, where organic carbon has fallen from 4% to 1-2% due to mechanized agriculture. Conservation agriculture rebuilds soil carbon. It can sequester 3-15 bn tons of CO2 per year, generating carbon credits, while restoring loss-making farmlands to exceptional profitability. Fertilizer demand would be decimated. This 17-page report outlines the opportunity, costs, CO2-removal, winners and losers.


Soils contain 3x more carbon than the atmosphere. But soils have shed 120bn tons of carbon since the dawn of mechanized farming. This is darkly etched into world history, with events such as the US dust bowl. Stemming the net loss of soil carbon is crucial to our energy transition models (pages 2-5).

Conservation agriculture is an emerging practice to restore soil carbon. Its tenets and achievements are described on page 6.

How much CO2 can be removed by conservation agriculture? We have surveyed the academic literature and modelled the potential impact (pages 7-8).

The economics are exceptional, evidenced by a detailed case study, with loss-making croplands transformed to profitability (pages 9-10).

Adoption is in an early innings. Policies are summarized in key geographies such as Alberta, Australia, France and the US. Private companies are now appearing to accelerate the theme. Some have ties to Shell (pages 11-12).

Technology leaders for measuring soil carbon are summarized on page 13-14.

The global fertilizer industry is disrupted by the theme, as fertilizer application can be cut 50-90% using conservation agricultures’ practices. Fertilizer production comprises 1% of global CO2. We profile the largest public companies and their CO2 intensity (pages 15-16).

What oil price is best for energy transition?

best oil price for energy transition

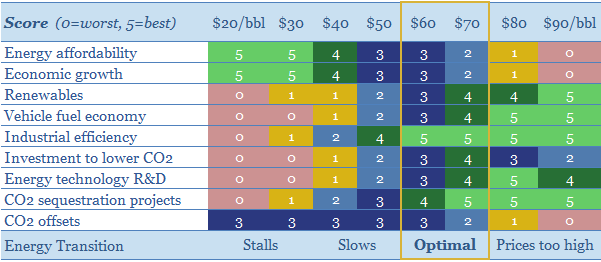
It is possible to decarbonize all of global energy by 2050. But $30/bbl oil prices would stall this energy transition, killing the relative economics of electric vehicles, renewables, industrial efficiency, flaring reductions, CO2 sequestration and new energy R&D. This 15-page note looks line by line through our models of oil industry decarbonization. We find stable, $60/bbl oil is the best oil price for energy transition.


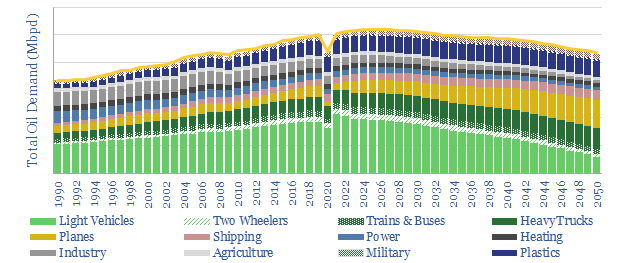
Our roadmap for the energy transition is outlined on pages 2-4, obviating 45Mbpd of long-term oil demand by 2050, looking across each component of the oil market.

Vehicle fuel economy stalls when oil prices are below $30/bbl, amplifying purchases of inefficient trucks and making EV purchases deeply uneconomical (pages 5-6).

Industrial efficiency stalls when oil prices are below $30/bbl, as oil outcompetes renewables and more efficient heating technologies (page 7).

Cleaning up oil and gas is harder at low oil prices, cutting funding for flaring reduction, methane mitigation, digitization initiatives and power from shore (pages 8-9).

New energy technologies are developed more slowly when fossil fuel prices are depressed, based on R&D budgets, patent filings and venturing data (pages 10-11).

CO2 sequestration is one of the largest challenges in our energy transition models. CO2-EOR is promising, but the economics do not work below $40/bbl oil prices (pages 12-14).

Our conclusion is that policymakers should exclude high-carbon barrels from the oil market to avoid persistent, depressed oil prices, and stabilize oil at the ‘best oil price for energy transition’ (as outlined on page 15).

Upstream technology leaders: weathering the downturn?

Upstream oil and gas technology leaders

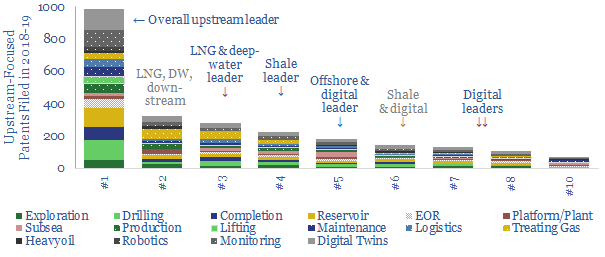
Leading technologies correlate 50-80% with ROACEs and -88% with costs in the energy industry. Hence, we assessed 6,000 patents from 2018-19, to determine which Energy Majors are best-placed to weather the downturn, benefit from dislocation and thrive in the recovery. This 14-page research note finds clear leaders in onshore, offshore, shale, LNG and digital, while others in the industry may be pulling back from upstream oil and gas.


Pages 2-4 quantify the importance of leading technologies in uplifting energy industry returns and deflating costs, including worked examples.

Pages 4-5 outline the added importance of technologies amidst the current downturn, its evolution and the industry’s potentially rapid recovery.

Page 6 explains how we use patents to identify technology leaders in energy.

Pages 7-13 explain who are the upstream technology leaders: onshore, offshore, in deep-water, unconventionals (shale), LNG and digital technologies. This informs which companies will emerge strongest from the current downturn, and how they may react amidst the dislocation.

Page 14 quantifies how upstream patent filings have changed YoY. Some Majors appear to be backing away from upstream technologies, possibly due to fears over the energy transitions, while others have stepped up their focus.

The work follows on from last year’s deep-dive report, identifying patent leaders in energy.

Digitization after the crisis: who benefits and how much?

Digitization after COVID-19 crisis who benefits how much

Digitization offers superior economics and CO2 credentials. But now it will structurally accelerate due to higher resiliency: Just 8% of digitized industrial processes will be materially disrupted due to COVID-19, compared to 80% of non-digitized processes. In this 22-page research report, we have constructed a database of digitization case studies around the energy industry: to quantify the benefits, screen the most digital operators and identify longer-term winners from the supply chain.


Pages 2 outlines our database of case studies into digitization around the energy industry.

Page 3 quantifies the percentage of the case studies that reduce costs, increase production, improve safety and lower CO2.

Pages 4-6 show how digitization will improve resiliency by 10x during the COVID-crisis, stoking further ascent of energy industry digitization.

Page 7 generalizes to other industries, arguing digitization will accelerate the theme of remote working, esepcially in physical manufacturing sectors.

Pages 8-9 screen for digital leaders among the 25 largest energy companies in the world, based on our assessment of their patents, technical papers and public disclosures.

Pages 10-11 identify leading companies from the supply chain, which may benefit from the acceleration of industrial digitization; again based on patents and technical papers.

Pages 12-22 present the full details of the digitization case studies that featured in our database, highlighting the best examples, key numbers and leading companies; plus links to delve deeper, via our other research, data and models.

Remote possibilities: working from home?

working from home for energy transition

The COVID-19 crisis will structurally accelerate remote working. The opportunity is explored in our 21-page report. It can save 30% of commuter journeys by 2030, avoiding 1bn tons of CO2 per year, for a net economic benefit of $5-16k per employee. This makes remote work a materially more impactful opportunity than electric vehicles in the energy transition.


Remote work currently saves c3% of all US commuter miles, which comprise 33% of developed world gasoline demand (pages 2-4).

Remote work could save 30% of all commuter miles by 2030, structurally accelerating as the COVID-19 crisis changes habits (page 5).

Remote work, thus screens as more impactful than electric vehicles, as an economic opportunity in the energy transition (page 6).

Ecconomic benefits are $5-16k pp pa. Our numbers are conservative. They under-reflect productivity and wellbeing improvements in the technical literature (pages 7-8).

We stress test our numbers, looking profession-by-profession across the entire US labor force, and considering new technologies (pages 9-13).

Direct energy impacts save 1bn tons of annual CO2. Impacts on oil, gas and electricity demand are quantified, including evidence from the COVID crisis (pages 14-17).

Hidden consequences are more nuanced: reshaping mobility, urbanization and online retail habits (pages 18-21).

COVID-19: what have the oil markets missed?

Impacts of COVID-19 coronavirus on global oil demand

This 15-page note outlines our top three conclusions about COVID-19, which the oil markets may have missed. First, global oil demand likely declines by -11.5Mbpd YoY in 2Q20 due to COVID-19. This is over 15x worse than the global financial crisis of 2008-9, and too large for any coordinated production cuts to offset. Second, once the worst of the crisis is over, new driving behaviours could actually increase gasoline demand, causing a very sharp oil recovery. Finally, over the longer-term, structural changes will take hold, transforming the way consumers commute, shop and travel. (Please note, our oil supply-demand numbers have subsequently been updated here).


Pages 2-7 outline our new models of global oil demand and US gasoline demand, underpinning a scenario where oil demand likely falls -11.5Mbpd in 2Q20, and -6.5Mbpd YoY in 2020. In a more extreme downside case, declines of -20Mbpd in 2Q20 and 10Mbpd in FY20 are possible.

Pages 8-10 illustrate how gasoline demand could actually increase in the aftermath of the COVID crisis, once businesses re-open and travel resumes. The largest cause is a c25% potential degradation in developed world fuel economy per passenger, as lingering fears over COVID lower the use of mass transit and vehicle load factors.

Pages 11-15 outline our top three structural trends post-COVID, which will persist for years, transforming retail, commuting, leisure travel and the airline/auto industries.

Please don’t hesitate to contact us, if you have any questions or comments…

How to decarbonize gas value chains?

How to structure a decarbonized gas value chain with forests

Gas value chains present the largest and lowest cost decarbonization opportunity on the planet, commercialising zero carbon energy for an incremental cost below $1/mcfe ($17/ton of CO2). This compares with end gas prices of $4-14/mcf and other CO2 mitigation options up to $800/ton. This 15-page report outlines how to optimize a decarbonized gas value chain, securitizing forestry-based carbon commitments in an actively managed carbon fund.


Pages 2-4 outline why natural gas is the optimal fossil fuel for a decarbonized value chain, requiring the reforestation of 15-60% less land than other fossil fuels.

Pages 5-8 present the economics for forestry projects, with a breakeven cost of $50/ton, of which $15/ton is cash cost and $35/ton is capital cost.

Pages 9-11 explain how to securitize forestry carbon credits into gas sales agreements, obviating the $35/ton capital costs and creating a dedicated CO2 fund.

Pages 12-13 compare the costs of our decarbonized gas value chains against other decarbonization options, at $15/ton versus $300-800/ton for alternatives.

Pages 14-15 suggest opportunities for active managers to optimize carbon funds, sequestering more CO2 and disbursing “profits” to the funds’ limited partners.

The future of offshore: fully subsea?

Fully Subsea Solutions

Offshore developments will change dramatically in the 2020s, eliminating new production platforms in favour of fully subsea solutions. The opportunity can increase a typical projectโ€™s NPV by 50%, reduce its breakeven by one-third and effectively eliminate upstream CO2 emissions. We have reviewed 1,850 patents to find the best-placed operators and service providers, versus others that will be disrupted. Overall, the theme supports the ascent of low-carbon natural gas, which should treble in the energy mix by 2050. This 22-page note presents the opportunity.


The offshore oil and gas industry’s progress towards ‘fully subsea’ developments, without any platforms or surface infrastructure being necessary, is reviewed in detail in pages 2-5, covering key projects and milestones from 1985-2000.

30% economic savings in both capex and opex are quantified line-by-line, across c50 cost lines, in pages 6-9.

1.5x NPV uplifts and 4pp IRR uplifts are quantified by modelling a representative fully greenfield gas-condensate project on pages 11-12.

CO2 emissions can be virtually eliminated by a fully subsea development solution. Pages 12-13 add up the impacts of higher efficiency, power from shore, fewer materials and the elimination of PSV/helicopter trips.

The key engineering challenges for fully subsea systems, which remain to be resolved, are summarized on page 14.

Who benefits from the trend toward fully subsea systems, is described from page 15 onwards after reviewing 1,850 patents around the industry. This includes both the leading service companies and operators (primarily Equinor, but also TOTAL, Shell).

The leaders in subsea compression technology are assessed on pages 16-17.

The leaders in subsea power systems are described on pages 18-19.

The leaders in next-generation subsea robotics are assessed on pages 20-21.

Others are disrupted, as is described in detail in page 22.

Covered service companies in the report include ABB, Aker, Eelume, GE, Kraken, Oceaneering, OneSubsea, Saipem, Siemens, Technip-FMC, Wood Group, the PSV and helicopter sector, and c20 early stage companies in next-generating subsea robotics.

Decarbonized power: how much wind and solar fit the optimal grid?

when will wind and solar peak?

What should future power grids look like? Our 24-page note optimizes cost, resiliency and CO2, using a Monte Carlo model. Renewables should not surpass 45-50%. By this point, over 70% of new wind and solar will fail to dispatch, while incentive prices will have trebled. Batteries help little. They raise power prices by a further 2-5x to accommodate just 3-15% more renewables. The lowest-cost, zero-carbon power grid, we find, comprises c25% renewables, c25% nuclear and c50% decarbonized gas, with an incentive price of 9c/kWh.


Pages 2-4 illustrate the volatility of wind and solar generation at today’s grid penetration, providing rules of thumb around intermittency.

Pages 5-6 illustrate the strange consequences once renewables surpass 25% of the grid, including curtailment, negative power pricing and financing difficulties.

Pages 7-9 quantify and explain how much curtailment will take place in a typical grid as renewables scale from 25% to 40%, 50% and 60% of gross generation, using a Monte Carlo approach. The model shows when and why curtailment is occurring.

Pages 10-20 quantify and explain the costs of batteries, to backstop renewables as they scale from 25%, to 40%, 50% and 60% of the grid, while avoiding curtailment. Real world conditions are not conducive to competitive battery economics.

Pages 21-23 quantify the residual reliance on natural gas. Amazingly, even our most aggressive battery scenarios only permit 10% of gas-power capacity to be shuttered. Low-utilization gas is costly. High-utilization gas is less costly. And the economics of decarbonized gas are superior to any renewables plus batteries combination.

Page 24 concludes that natural gas will emerge as the ‘best battery’ to backstop renewables, estimating the most likely shares in an optimal power mix.

Copyright: Thunder Said Energy, 2019-2024.