Guyana: carbon credentials & capital costs?

Guyana carbon credentials

Prioritising low carbon barrels will matter increasingly to investors, as they can reduce total oil industry CO2 by 25%. Hence, these barrels should attract lower WACCs, whereas fears over the energy transition are elevating hurdle rates elsewhere and denting valuations. In Guyana’s case, the upshot could add $8-15bn of NAV, with a total CO2 intensity that could be c50% below the industry average.


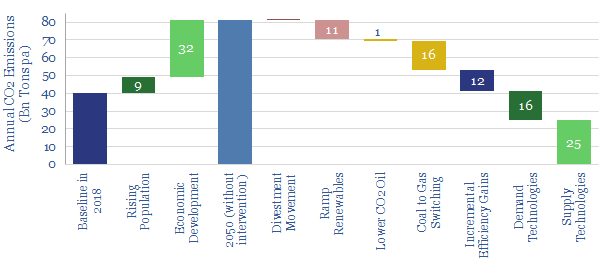
Pages 2-3 introduce our framework for decarbonisation of the global energy system. Within oil, this requires prioritising lower carbon over higher carbon oil barrels.

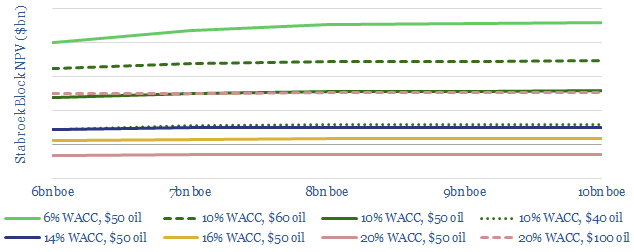
Pages 3-6 outline the economic value in Guyana, which is now at the point where it is hard to move the needle with further resource discoveries.

Pages 7-8 show how lower WACCs can be trasnformative to resource value, even more material than increasing oil prices to $100/bbl.

Pages 9-17 outline the top technologies that should minimise Guyana’s CO2 emissions per barrel, including flaring policies, refining quality, midstream proximity, proprietary gas turbine technologies from ExxonMobil’s patents and leading digital technologies around the industry.

Our conclusion is that leading companies must deepen their efforts to minimise CO2 intensities and articulate these initiatives to the market.

Key points on Guyana carbon credentials and oil capital costs are spelled out in the article sent out to our distribution list.

Investing for an energy transition

Investing for an energy transition

What is the best way for investors to decarbonise the global energy system? We argue this outcome is achievable by 2050. But a new ‘venturing’ model is needed, to incubate better technologies. CO2 budgets can also be stretched furthest by re-allocating to gas, lower-carbon oil and lower-carbon industry. But divestment is a grave mistake. These are the conclusions in our new, 18-page report.


The global energy system could be decarbonised by 2050 (chart above). Yet today’s renewable technologies are only sufficient to meet c15% of the challenge. The largest component, at c50%, requires new energy technologies: both to economize demand and decarbonise supplies, which will most likely remain fossil-dominated to 2100.

Other routes are dangerous. The ‘divestment movement’ seeks to cut off capital for fossil fuels. This does not yield an energy ‘transition’, but a devastating energy ‘shortage’. Scaling up new technologies requires more capital, not less (see pages 2-7 in the PDF).

Is the investment community configured for energy transition? We fear not.

First, the investment process should favour lower-carbon suppliers across every industry, to incentivise efficiency. Within energy, this includes natural gas, low-carbon oil over higher-carbon oil (saving 500MTpa of CO2) and technology-leaders (see pp 8-11).

A new breed of venture funds is most needed, so investors can allocate capital to economically promising technologies. These opportunities are extremely exciting, based on all of our research. For example, we argue leading Energy Majors should offer up co-investments in their venture funds (see pp 12-16).

Drones & droids: deliver us from e-commerce

Drones and Droids Impact on Retail

Small, autonomous, electric delivery vehicles are emerging. They are game-changers: rapidly delivering online purchases to customers, creating vast new economic possibilities, but also driving the energy transition. Their ascent could eliminate 500MTpa of CO2, 3.5Mboed of fossil fuels and c$3trn pa of consumer spending across the OECD. The mechanism is a re-shaping of urban consumption habits, retail and manufacturing. The opportunities are outlined in our new, 20-page report.


The average US consumer buys 2.5 tons of goods per year, served by a vast distribution network of ships, trucks and smaller vehicles, collectively responsible for 1.5 barrels of oil, $1,000 of cost and 600kg of CO2 per person per annum (page 2).

Fuel economy currently deteriorates, with each step closer to the consumer. Container ships achieve c900 ton-miles per gallon of fuel. But delivery vans, the dominant delivery mechanism for internet purchases, are least efficient, achieving just 0.02 effective ton-mpg and costing at least $3.6 per delivery (page 3).

The rise of e-commerce has already increased supply chain CO2 by c30%, and supply chain costs by 2x since the pre-internet era. On today’s technologies, CO2 will rise another 20% and cost will rise another 50% by 2030, adding 0.7Mbpd of oil demand, 120MTpa of CO2 and $500bn of cost across the OECD (pages 4-5)

Drones and droids are 90-99% less energy intensive than delivery vans, and 70-97% less costly. The technology is maturing. Thus small, autonomous, electric vehicles will move immediately, efficiently, straight to their destination (pages 6-8).

Retail and manufacturing will have be transformed by the time drones approach 50% market share in last-mile delivery. Tipping-point economies-of-scale mean that they will take market share away from cars and delivery vans very rapidly (pages 9-10).

The second half of the report focuses in on the opportunities. Retail businesses must consolidate, specialise or diversify to “sharing” models. The latter can save $1trn of consumer spending and 100MTpa of emissions in the US alone (pages 11-20).

2050 oil markets: opportunities in peak demand?

long run oil demand

Many commentators fear long-run oil demand is on the cusp of a steep contraction, leaving oil and gas assets stranded. We are more concerned about the opposite problem. Projecting out the current trends, global oil demand is on course to keep rising to over 130Mbpd by 2050, undermining attempts to decarbonise the world’s energy system.

Our new, 20-page note reviews seven technology themes that can save 45Mbpd of long-term oil demand. We therefore find oil demand would plateau at 103Mbpd in the 2020s, before declining gradually to 87Mbpd in 2050. This is still an enormous market, equivalent to 1,000 bbls of oil being consumed every second.

Opportunities abound in the transition, in order to deliver our seven themes, improve mobility, substitute oil for gas, reconfigure refineries for changing product mixes, and to ensure that the world’s remaining oil needs are supplied as cleanly and efficiently as possible. Leading companies will seize these opportunities, driving the transition and earning strong returns in the process.

Patent Leaders in Energy

patent leaders in energy

Technology leadership is crucial in energy. It drives costs, returns and future resiliency. Hence, we have reviewed 3,000 recent patent filings, across the 25 largest energy companies, in order to quantify our “Top Ten” patent leaders in energy.


This 34-page note ranks the industry’s “Top 10 technology-leaders”: in upstream, offshore, deep-water, shale, LNG, gas-marketing, downstream, chemicals, digital and renewables.

For each topic, we profile the leading company, its edge and the proximity of the competition.

Companies covered by the analysis include Aramco, BP, Chevron, Conoco, Devon, Eni, EOG, Equinor, ExxonMobil, Occidental, Petrobras, Repsol, Shell, Suncor and TOTAL.

Upstream technology leaders have been discussed in greater depth in our April-2020 update, linked here.


More information? Please do not hesitate to contact us, if you would like more information about accessing this document, or taking out a TSE subscription.

US Shale: No Country for Old Completion Designs

Shale productivity gains

2019 has evoked resource fears in the shale industry. They are unfounded. Even as headline productivity weakened, underlying productivity continues improving at an exciting pace. These conclusions are substantiated by reviewing 350 technical papers, published by the shale industry in summer-2019. Major improvements are gathering momentum, in shale-EOR, machine learning techniques, digitalization and frac fluid chemistry.


Discussed companies include Apache, BP, Conoco, Chevron, Devon, ExxonMobil, Halliburton, Occidental, Pioneeer & Schlumberger.

Page 2 compares 2019’s shale performance to-date with our January forecasts, identifying that initial-month producutivity has been 20% weaker YoY.

Page 3-4 shows how continued productivity improvements matter, to unlock >20Mbpd of potential US shale output, plus $300bn of FCF by 2025 (at $50/bbl oil).

Pages 5-8 explain away the apparent degradation in resource productivity: it is a function of three alterations to completion designs.

Pages 9-12 outline 350 technical papers from the shale industry in summer-2019. They restore confidence: the industry is not facing systemic resource issues.

Page 12 covers 24 technical papers into “parent-child” issues. We were surprised by the number that were ‘negative’ versus the pragmatic solutions offered in others.

Page 13, 14 & 17 cover leading digitalization technologies: deployment of machine learning increased 5x YoY, while DAS/DTS increased 3x YoY in 2019.

Pages 14-16 cover the maturation of shale-EOR, which was the greatest YoY improvement, reaching 32 papers in 2019. The cutting-edge of EOR is exciting.

Page 18 outlines other technical highlights to drive future productivity higher.

Mero Revolutions: countering CO2 in pre-salt Brazil?

Mero field in pre-salt Brazil

The super-giant Mero field in pre-salt Brazil is not like its predecessors. While prolific, it has a 2x higher gas cut, of which c45% is corrosive and environmentally unpalatable CO2. Hence, Petrobras, Shell, TOTAL and two Chinese Majors are pushing the boundaries of deepwater technology. Our new, 16-page note assess four innovation areas, which could unlock $2bn of NPV upside. But the distribution of outcomes remains broad. $4bn is at risk if the CO2-challenges are not overcome.


Page 2 provides background on pre-salt Brazil, especially the flagship Lula project, which a new super-giant, Mero, is trying to emulate.

Page 3-4 contrast Mero to Lula, based on data from flow-tests. Mero has a 2x higher gas-cut and c8x higher CO2.

Page 5 reviews Petrobras’s own internal concerns over CO2-handling at Mero, and how they are expected to sway the decline rates at the field.

Page 6 outlines our valuation of the Mero oilfield, testing different CO2-handling scenarios. Our full model is also available.

Pages 7-8 review Mero’s FPSO design adaptations, to handle the field’s higher gas and CO2. These will be 2-2.5x larger FPSOs than Lula, by tonnage.

Pages 8-10 illustrate pipeline bottlenecks facing pre-salt Brazil. After considering alternative options (re-injection, LNG), we argue more pipelines may be needed.

Pages 10-12 describe riser innovations, which may help handle the risks of CO2-corrosion at Mero. One option is overly complex. The other is more promising.

Pages 12-16 cover the holy grail for Mero’s CO2, which is subsea CO2 separation. This would be a major industry advance, and unlock further billion-barrel resource opportunities. Upcoming hurdles and challenges are assessed.

Pages 15-16, in particular, cover Shell’s industry-leading deepwater technology, which may be helpful in maximising value from the resource, longer-term.

Johan Sverdrup: Don’t Decline?

Johan Sverdrup’s decline rates

Equinor is deploying three world-class technologies to mitigate Johan Sverdrup’s decline rates, based on reviewing c115 of the company’s patents and dozens of technical papers. Our new 15-page note outlines how its efforts may unlock an incremental $3-5bn of value from the field, as production surprises to the upside.


Pages 2-3 provide the context of the Johan Sverdrup field, its implied decline rates and how their variability will determine the field’s ultimate value.

Page 4 re-caps the concept of decline rates and how they should be measured.

Pages 5-7 recount the history of Digital Twin technologies, the cutting edge of their application offshore Norway and evidence for Equinor’s edge, as it deploys the technology at Sverdrup.

Pages 8-11 illustrate the upside in Permanent Reservoir Monitoring, comparing Equinor’s plans versus prior achievements deploying the technology off Norway.

Page 12-14 show the cutting-edge technology that excites us most: combining two areas where Equinor has established a leading edge. This opportunity can improve well-level production rates by c1.5x.

Page 15 ends by touching upon other technologies that will be applied at Sverdrup, quantifying Equinor’s offshore patent filings versus other listed Majors’.

Scooter Wars?

energy economics of electric scooters

E-scooters can transform urban mobility, eliminating 2Mbpd of oil demand by 2030, competing amidst the ascent of “electric vehicles” and re-shaping urban economies.  These implications follow from e-scooters having 25-50x higher energy efficiencies, higher convenience and c50% lower costs than gasoline vehicles, over short 1-2 mile journeys. Our 12-page note explores the consequences. 


Page 2 charts the meteoric ascent of e-scooters. In their first year of deployment, they matched the peak growth rate of taxi-apps (e.g., Uber) and overtook ride-sharing bicycles which have been under commercialisation for quarter-of-a-century.

Page 3 assesses the leading companies, all of which launched in late-2017 or early-2018, and have since raised $1.5bn.

Pages 4-5 compares the energy-economics of electric scooters with fourteen other vehicle concepts, explaining the physics of e-scooters’ 25-50x higher efficiencies.

Page 6 compares the relative benefits of e-scooters versus electric cars, which are clearest when comparing the relative strain on grid infrastructure.

Pages 7-8 show how e-scooters displace oil demand, outlining our projections for 2Mbpd of demand destruction globally by 2030. This oil demand is not “replaced” by electricity demand. c95-98% of it is simply eliminated.

Pages 9-11 model the per-mile costs of e-scooters, as a function of multiple input variables, showing the most competitive contexts relative to cars and taxis.

Page 12 ends by exploring potential consequences for urban economies. Most of all, we expect economic growth to be supported, particularly for retail; conversely e-mobility may embolden policymakers to ban gasoline vehicles from cities.

De-Carbonising Carbon?

De-Carbonising Carbon

Decarbonisation is often taken to mean the end of fossil fuels. But it is more feasible simply to de-carbonise them, with next-generation combustion technologies.

This 19-page note presents our top two opportunities: ‘Oxy-Combustion’ using the Allam Cycle and Chemical Looping Combustion. Both can provide competitive energy with zero carbon coal & gas.

Leading Oil Majors are supporting these solutions, to create value while advancing the energy transition.


Carbon capture remains an “orphan technology”, absorbing just c0.1% of global CO2. The costs and challenges of current technologies are profiled on pp2-4.

Energy penalties are particularly problematic. Paradoxically, the more CCS in our models, the longer it takes to de-carbonise the energy system (see pp5-6).

Next generation combustion-technologies are therefore necessary…

Allam Cycle Oxy-Combustion burns CO2 in an inert atmosphere of CO2 and oxygen. We evaluate a demonstration plant and model strong economics (see pp12-15).

Chemical Looping Combustion burns fossil fuels in a fluidized bed of metal oxide. We profile the technology’s development to-date, net efficiency and levellised costs, which are passable (pp8-11).

Oil Majors are driving the energy transition. We count ninety patents from leading companies to process CO2, including 30 to de-carbonise power. The best advances are profiled from TOTAL, Occidental, Aramco and ExxonMobil. (See pp16-19).

Copyright: Thunder Said Energy, 2019-2024.