Search results for: “HVDC”
-
HVDC transmission: leading companies?
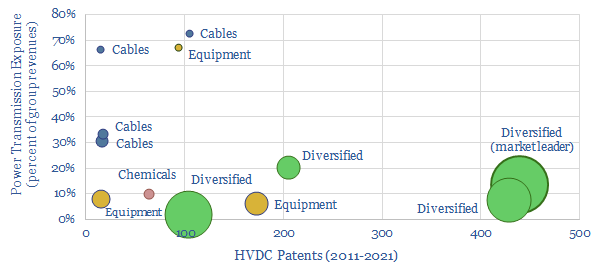
The global HVDC market is $10bn pa, and it might typically cost c€100-600 M to connect a large and remote renewables project to the grid or run a small HVDC inter-connector. This data-file reviews the market leaders in HVDC, based on 5,500 patents. A dozen companies stand out, with c$40bn of combined revenues from power…
-
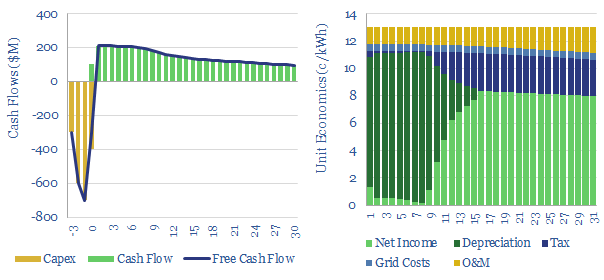
HVDC power transmission: the economics?
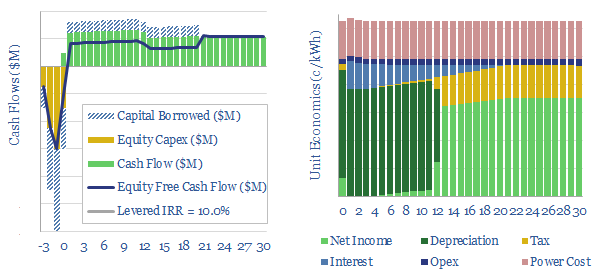
This model captures the economics of transporting electricity (e.g., wind and solar), over vast distances, using high voltage direct current power cables (HVDCs). Our base case shows a 3-10c/kWh transportation spread is required to earn a 10% levered IRR on 1,000-mile cable.
-
Electrical conductivity: energy transition materials?
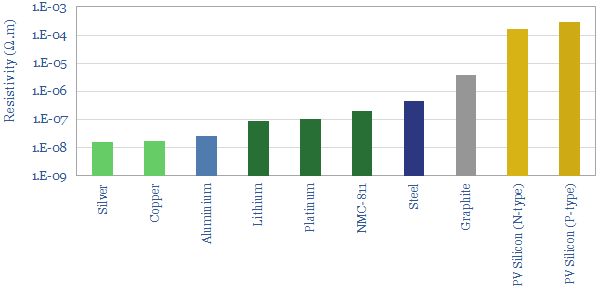
Electrical conductivity of energy transition materials is tabulated in this data-file. ‘The action’ takes place in the range of 10^-8 to 10^-3 Ohm-meters, including silver in solar cells, copper in renewables and EVs, aluminium transmission lines, batteries, and solar semiconductors.
-
Power grids: opportunities in the energy transition?
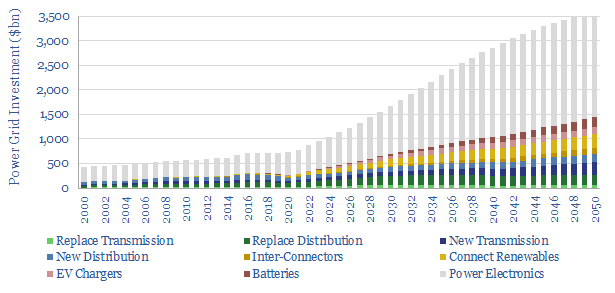
Power grids move electricity from the point of generation to the point of use, while aiming to maximize the power quality, minimize costs and minimize losses. Broadly defined, global power grids and power electronics investment must step up 5x in the energy transition, from a $750bn pa market to over $3.5trn pa. But this theme…
-
Offshore vessels: fuel consumption?
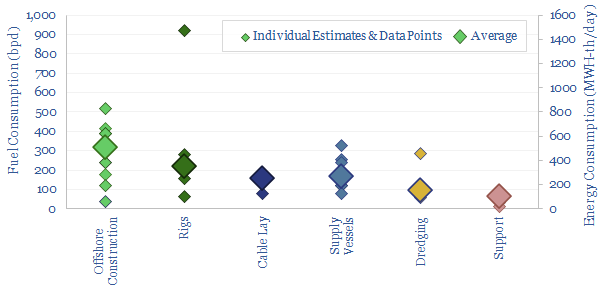
This database tabulates the typical fuel consumption of offshore vessels, in bpd and MWH/day. We think a typical offshore construction vessel will consume 300bpd, a typical rig consumes 200bpd, supply vessels consume 150bpd, cable-lay vessels consume 150bpd, dredging vessels consume 100bpd and medium-sized support vessels consume 50bpd. Examples are given in each category, with typical…
-
Power grids: transmission and distribution kilometers by country?
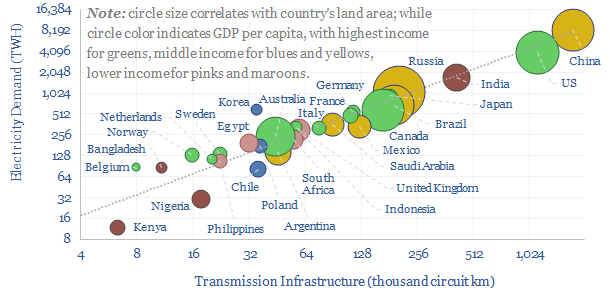
This data-file aggregates power transmission and distribution kilometers by country, across 30 key countries, which comprise 80% of global electricity use. In 2023, the world contains 7M circuit kilometers of power transmission lines and 110M kilometers of power distribution lines. Useful rules of thumb are in the data-file.
-
Offshore wind: levelized costs?
This model estimates the levelized cost of offshore wind at 13c/kWh, to generate a 7% IRR off of capex costs of $4,000/kW and a utilization factor of 40-45%. Each $400/kW on capex adds 1c/kWh and each 1% on WACC adds 1.3 c/kWh to offshore wind levelized costs.
Content by Category
- Batteries (89)
- Biofuels (44)
- Carbon Intensity (49)
- CCS (63)
- CO2 Removals (9)
- Coal (38)
- Company Diligence (95)
- Data Models (840)
- Decarbonization (160)
- Demand (110)
- Digital (60)
- Downstream (44)
- Economic Model (205)
- Energy Efficiency (75)
- Hydrogen (63)
- Industry Data (279)
- LNG (48)
- Materials (82)
- Metals (80)
- Midstream (43)
- Natural Gas (149)
- Nature (76)
- Nuclear (23)
- Oil (164)
- Patents (38)
- Plastics (44)
- Power Grids (130)
- Renewables (149)
- Screen (117)
- Semiconductors (32)
- Shale (51)
- Solar (68)
- Supply-Demand (45)
- Vehicles (90)
- Wind (44)
- Written Research (354)