Search results for: “methane leak leaks”
-
CH4 context: the largest methane leaks of all time?
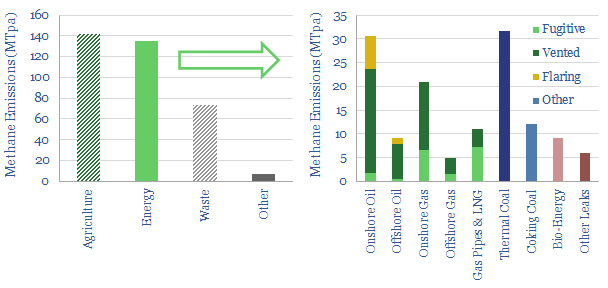
Global methane emissions run to 360MTpa. 40% is agriculture, 40% is the energy industry and 20% is landfills. Within energy, over 30% of the leaks are from coal, 30% are from oil, 27% are from gas. This short note quantifies some of the largest methane leaks of all time, and provides context for the recent…
-
Screen of companies detecting methane leaks?
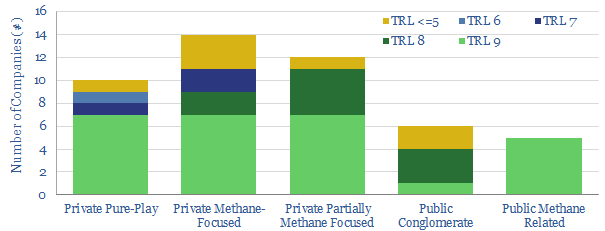
This data-file screens the methods available to monitor for methane emissions. Notes and metrics are tabulated. Emerging methods, such as drones and trucks are also scored, based on technical trials. The best drones can now detect almost all methane leaks >90% faster than traditional methods. c34 companies at the cutting edge are screened.
-
Methane slip: how much gas evades combustion?
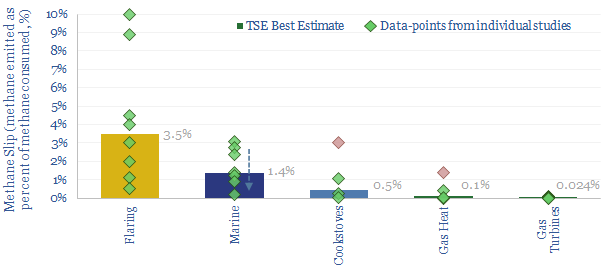
Methane slip occurs when a small portion of natural gas fails to combust, and instead escapes into the atmosphere. This data-file reviews different technical papers. Methane slip is effectively nil at gas turbines and gas heating (less than 0.1%). It rises to 0.5-3% in cookstoves and some dual-fuel marine engines. However, the highest rate of…
-
Methane emissions from pneumatic devices: by operator, by basin?
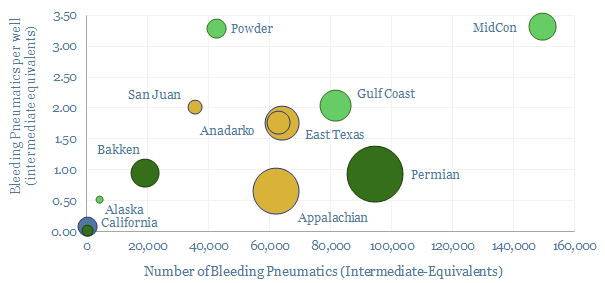
Methane leaks from 1M pneumatic devices across the US onshore oil and gas industry comprise 50% of all US upstream methane leaks and 20% of upstream CO2. This file aggregates the data. Rankings reveal operators with a pressing priority to replace >100,000 medium and high bleed devices, and other best-in-class companies.
-
US CO2 and Methane Intensity by Basin
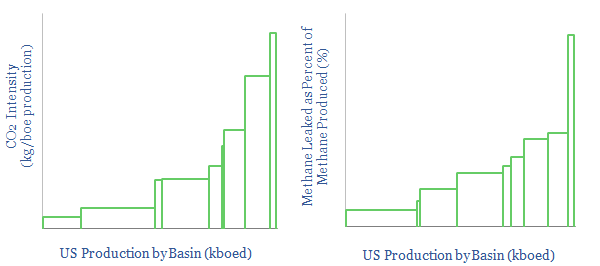
The CO2 intensity of oil and gas production is tabulated for 425 distinct company positions across 12 distinct US onshore basins in this data-file. Using the data, we can aggregate the total upstream CO2 intensity in (kg/boe), methane leakage rates (%) and flaring intensity (in mcf/boe), by company, by basin and across the US Lower 48.
-
Methane Leaks from Downstream Gas Distribution
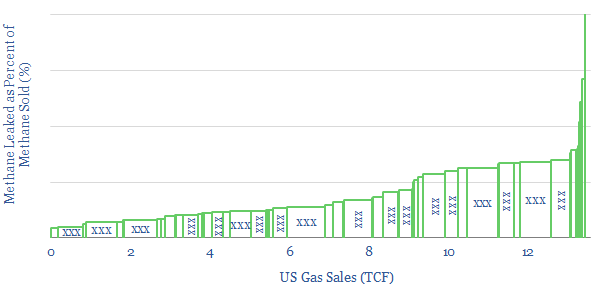
Methane leakages average 0.2% when distributing natural gas to end-customers, across the US’s 160 retail gas networks. Leakages are most correlated with the share of sales to smaller customers. 80 distinct gas companies are ranked in this data-file. State-owned utilities appear to have 2x higher leakage rates versus public companies.
-
CO2 intensity of coal production?
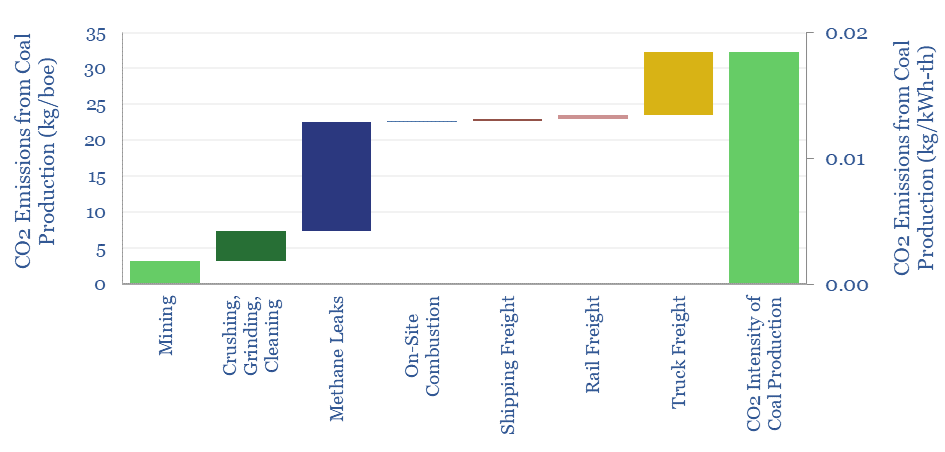
Producing a ton of coal typically emits 0.19T of CO2, equivalent to 50kg/boe. The numbers comprise mining, methane leaks and transportation. Hence domestic coal production will tend to emit 2x more CO2 than gas production, plus c2x more CO2 in combustion. However, numbers vary widely based on input assumptions, such as methane lakage rates, btu content…
-
Fugitive methane: what components are leaking?
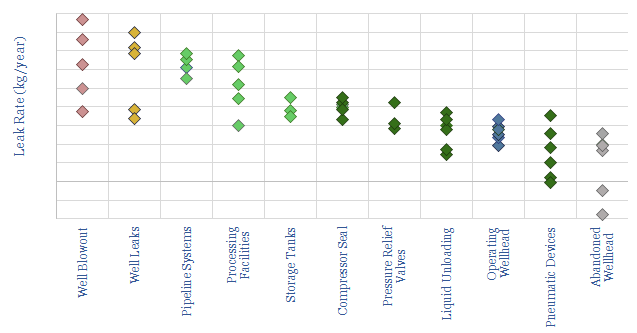
This data-file looks through 35 technical papers to tabulate methane leaks from different components around the oil and gas industry. The largest are losses of well control (up to 1MTpa), then mid-downstream facilities (up to 10kTpa), compressors (up to 100T), pneumatic devices, wellheads and liquid unloading (up to 10T).
-
Density of gases: by pressure and temperature?
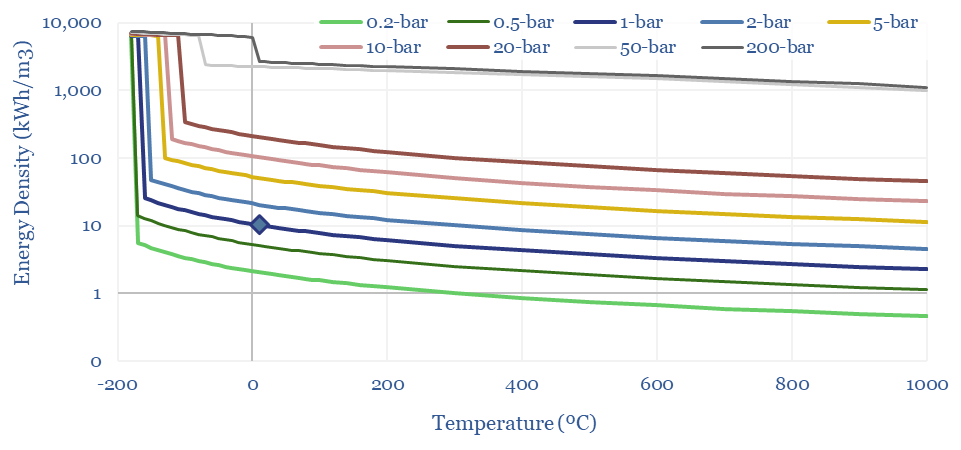
The density of gases matters in turbines, compressors, for energy transport and energy storage. Hence this data-file models the density of gases from first principles, using the Ideal Gas Equations and the Clausius-Clapeyron Equation. High energy density is shown for methane, less so for hydrogen and ammonia. CO2, nitrogen, argon and water are also captured.
-
Hydrogen: what GWP and climate impacts?
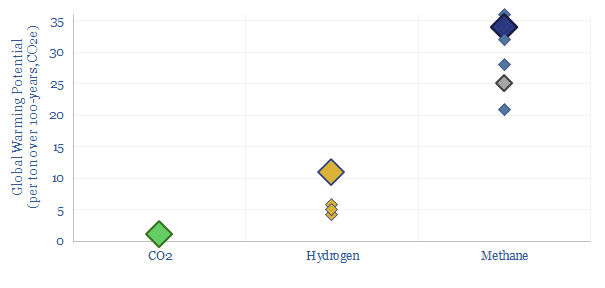
Hydrogen is an indirect GWP, as it breaks down in the atmosphere over 1-2 years, increasing the lifespan of other GHGs, such as methane. So what is hydrogen GWP versus methane? 1 ton of atmospheric H2 most likely causes 11x more warming than 1 ton of CO2 (the number for methane is 34x). Eight conclusions…
Content by Category
- Batteries (89)
- Biofuels (44)
- Carbon Intensity (49)
- CCS (63)
- CO2 Removals (9)
- Coal (38)
- Company Diligence (95)
- Data Models (840)
- Decarbonization (160)
- Demand (110)
- Digital (60)
- Downstream (44)
- Economic Model (205)
- Energy Efficiency (75)
- Hydrogen (63)
- Industry Data (279)
- LNG (48)
- Materials (82)
- Metals (80)
- Midstream (43)
- Natural Gas (149)
- Nature (76)
- Nuclear (23)
- Oil (164)
- Patents (38)
- Plastics (44)
- Power Grids (130)
- Renewables (149)
- Screen (117)
- Semiconductors (32)
- Shale (51)
- Solar (68)
- Supply-Demand (45)
- Vehicles (90)
- Wind (44)
- Written Research (354)